SPY (Equities) and the TLT (Treasury Bonds) Relationship Gets More Fascinating and More Complicated By the Day
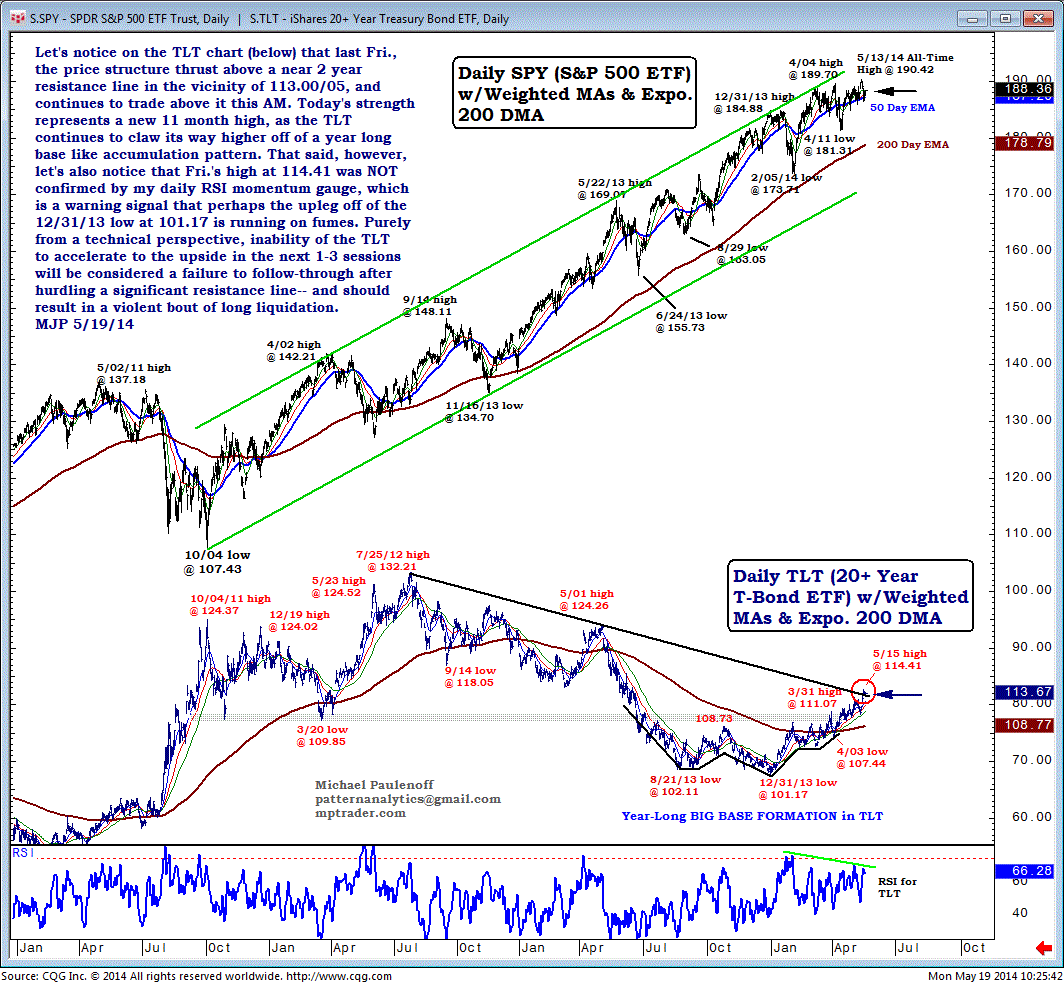
Let's notice on the iShares 20+ Year Treasury Bond (TLT) chart (below), that last Friday the price structure thrust above a near 2-year resistance line in the vicinity of 113.00/05, and continues to trade above it this morning.
Today's strength represents a new 11-month high, as the TLT continues to claw its way higher off of a year-long base-like accumulation pattern.
That said, however, let's also notice that Friday's high at 114.41 was not confirmed by my daily RSI momentum gauge, which is a warning signal that perhaps the upleg off of the Dec 31, 2013, low at 101.17 is running on fumes.
Purely from a technical perspective, inability of the TLT to accelerate to the upside in the next 1-3 sessions will be considered a failure to follow-through after hurdling a significant resistance line and should result in a violent bout of long liquidation.

