The SPY is at a Crossroads
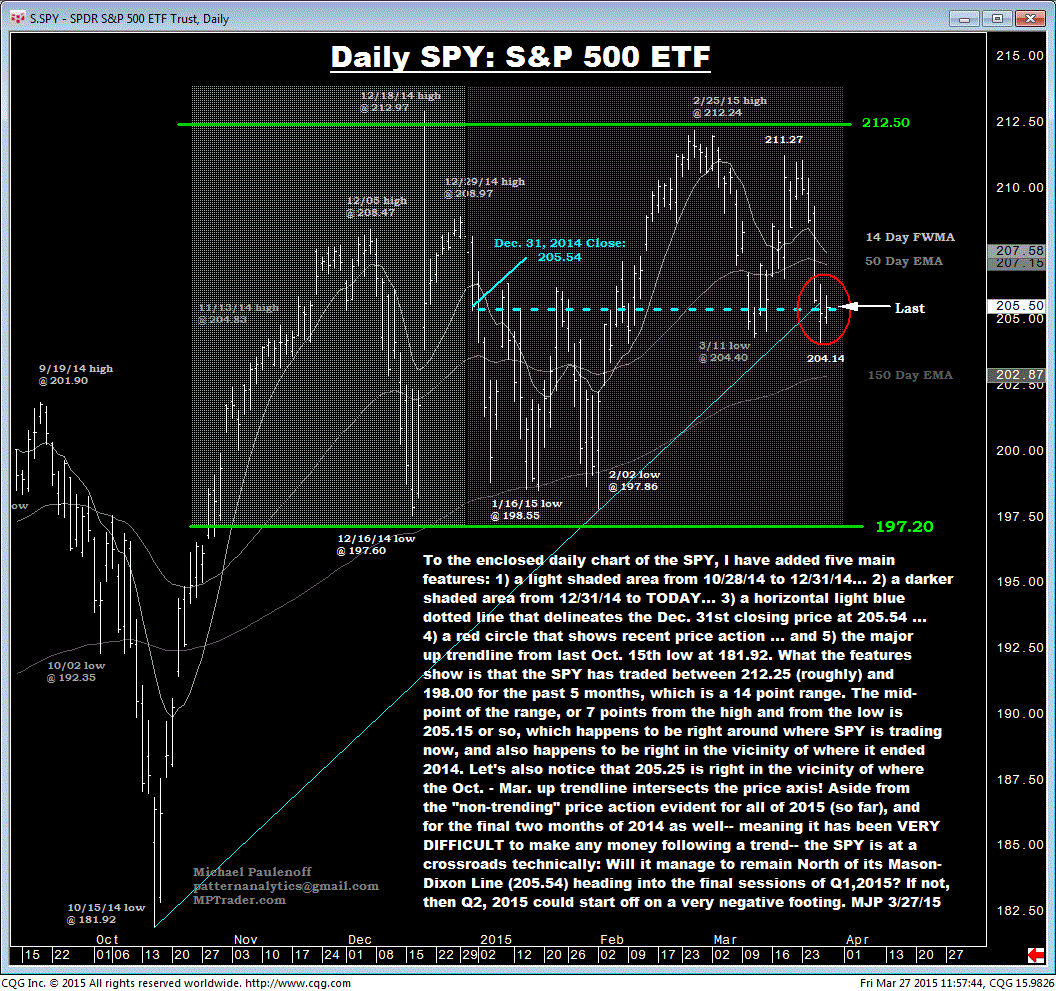
To the enclosed daily chart of the SPY, I have added five main features:
1) a light shaded area from Oct 28 14 to Dec 31, 2014...
2) a darker shaded area from Dec 31, 2014 to today...
3) a horizontal, light-blue dotted line that delineates the Dec 31st closing price at 205.54...
4) a red circle that shows recent price action ... and
5) the major up trendline from last Oct. 15th low at 181.92.
What the features show is that the SPY has traded between 212.25 (roughly) and 198.00 for the past 5 months, which is a 14 point range.
The mid-point of the range, or 7 points from the high and from the low is 205.15, or so, which happens to be right around where SPY is trading now, and also happens to be right in the vicinity of where it ended 2014.
Let's also notice that 205.25 is right in the vicinity of where the Oct - Mar up trendline intersects the price axis!
Aside from the "non-trending" price action evident for all of 2015 (so far), and for the final two months of 2014, as well-- meaning it has been very difficult to make any money following a trend-- the SPY is at a crossroads technically: Will it manage to remain North of its Mason-Dixon Line (205.54), heading into the final sessions of Q1, 2015?
If not, then Q2, 2015 could start off on a very negative footing.

