What Does Big Picture Macro-Chart Work Tell Us?
From the intermediate-term perspective of the enclosed 2-1/2 year charts of the major-macro indices, what might we conclude?
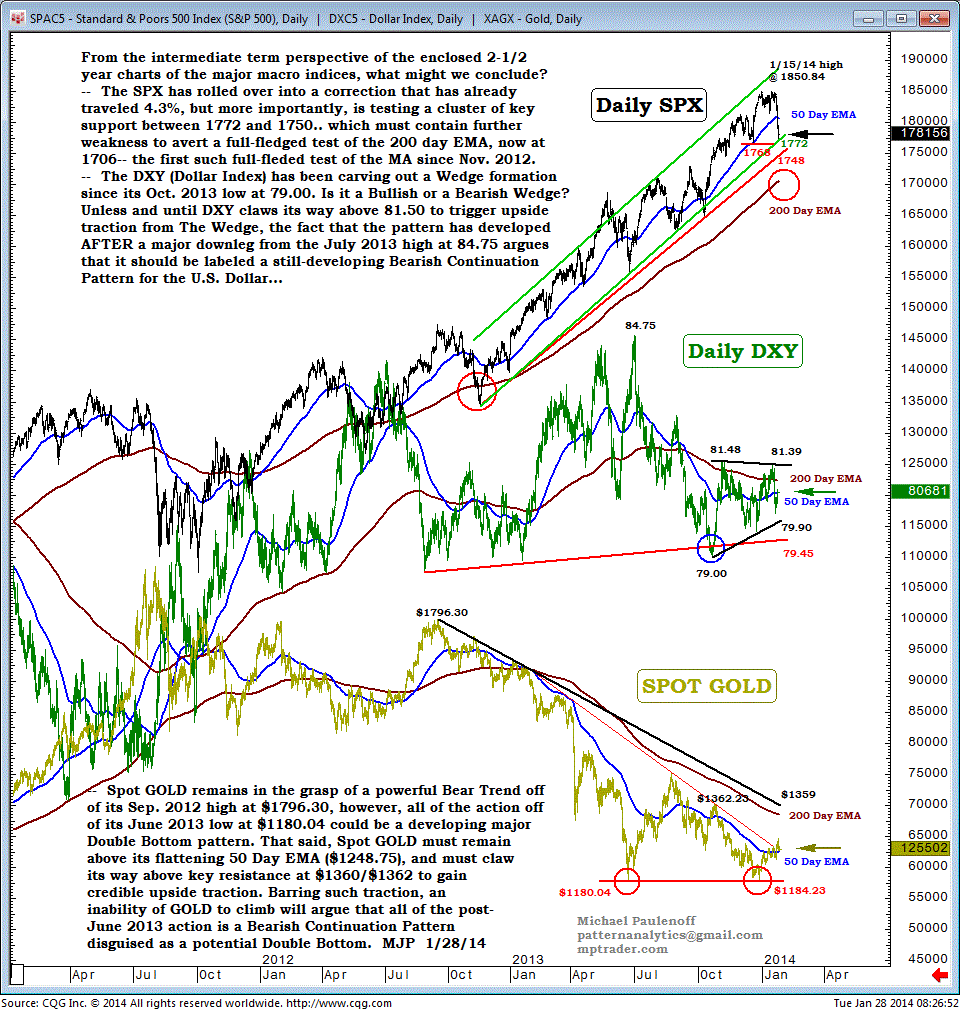
-- The SPX has rolled over into a correction that has already traveled 4.3%, but more importantly, is testing a cluster of key support between 1772 and 1750, which must contain further weakness to avert a full-fledged test of the 200-day EMA, now at 1706-- the first such full-fledge test of the MA since Nov. 2012.
-- The U.S. Dollar (DXY) has been carving out a wedge formation since its Oct. 2013 low at 79.00.
Is it a bullish or a bearish wedge?
Unless, and until, DXY claws its way above 81.50 to trigger upside traction from The Wedge, the fact that the pattern has developed after a major downleg from the July 2013 high at 84.75 argues that it should be labeled a still-developing bearish-continuation pattern for the U.S. Dollar...
-- Spot GOLD remains in the grasp of a powerful-bear trend off of its Sept 2012 high at $1796.30, however, all of the action off of its June 2013 low at $1180.04 could be a developing major double-bottom pattern.
That said, Spot Gold must remain above its flattening 50-day EMA at $1248.75, and must claw its way above key resistance at $1360/$1362 to gain credible-upside traction.
Barring such traction, an inability of Gold to climb will argue that all of the post-June 2013 action is a bearish-continuation pattern disguised as a potential-double bottom.