Alerting Members To Market's Warning Signs
On April 5, Mike Paulenoff discussed the following with MPTrader members about the significant negative behavior of the equity indices in general and the SPY (S&P 500 Equity Index ETF), writing:
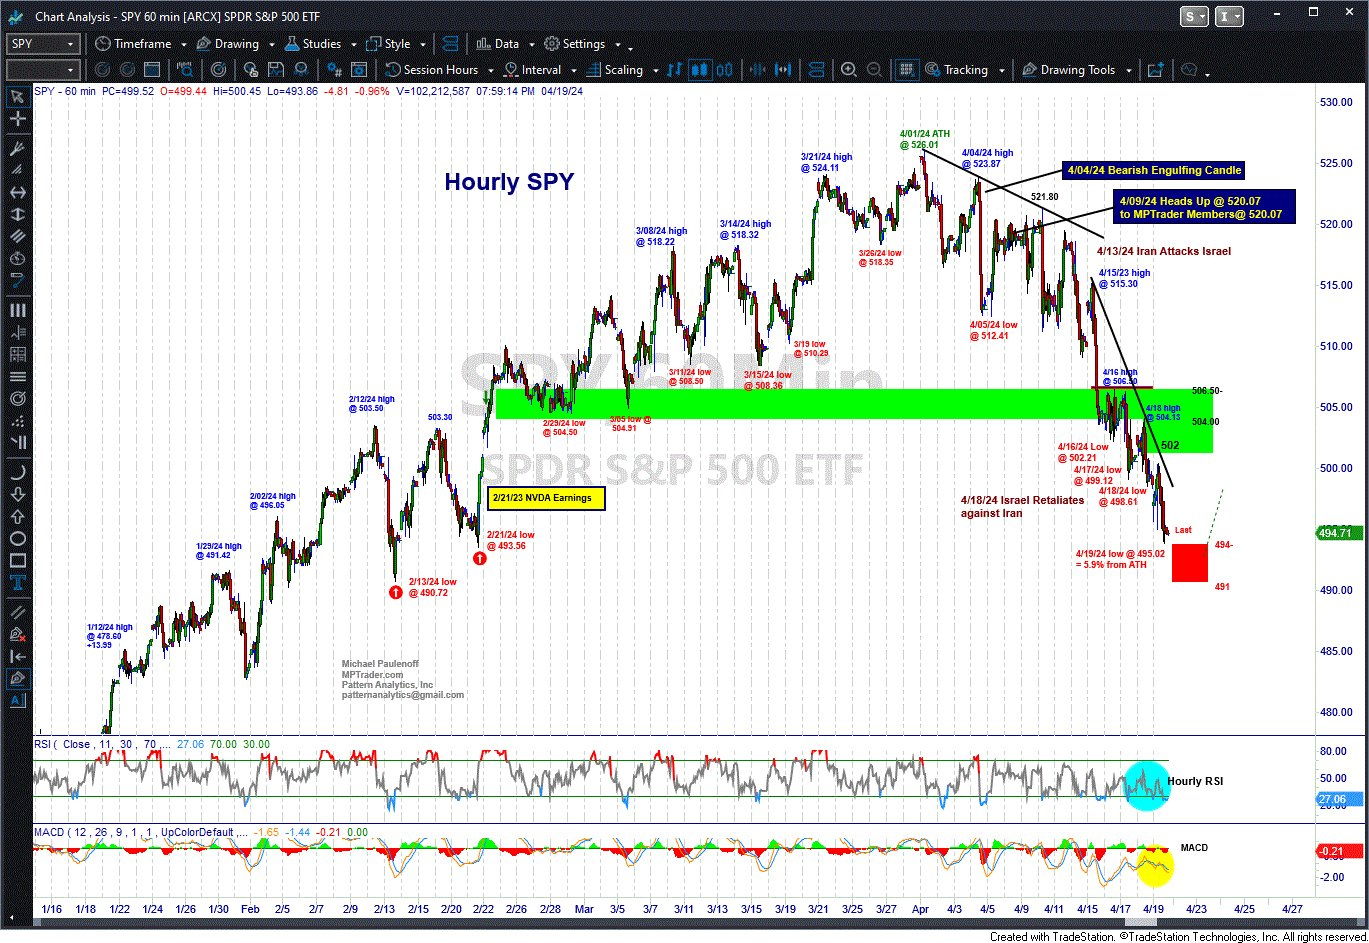
"... Yesterday's nosedive in the price action left behind a Bearish Engulfing Candle in SPY, SPX, ES, et al... My attached Big Picture Chart of SPY shows the powerful, relentless Oct-Apr. advance from 409.21 to 526.01 (+27%) followed by yesterday's Key Downside Reversal (Bearish Engulfing Candle) is a warning sign that SPY (et al) is exhausted, and has rolled over into some magnitude of correction that at yesterday's low amounted to 2.5% from the ATH (4/01/24).
"If this AM's data fails to lift SPY on a sustained basis above 518.60 into today's close, then SPY will remain vulnerable to downside continuation in the aftermath of yesterday's reversal and will be pointed toward a confrontation with the 50 DMA, now at 506.27, where the correction from the ATH will amount to 3.7%. To satisfy a 5% correction, SPY will have to press to 499.70. Deeper, more serious corrective plateaus are demarcated on my attached Daily Chart.
"From a near-term perspective, my view of the current technical setup is 'prove it to me,' meaning that if yesterday's downside reversal was a one-off event, then SPY needs to claw its way back above the 20 DMA, now at 517.30... Last is 514.77..."
Again on April 9, after multiple intraday and/or daily updates on the technical action in SPY, Mike posted the following update to the MPTrader Discussion Room:
"I have demarcated the key support zone of 504.50 to 512.50 which is juxtaposed against the key resistance zone of 522 to 526. To gain any meaningful technical upside traction SPY needs to hurdle and sustain 521.80-522.00. Conversely, weakness that violates and sustains beneath 516.95 will leave SPY vulnerable to a press into much more consequential support from 513.50 down to 512.40... Last is 520.07..."
Mike's charting along the way was (and is) an invaluable guidance tool for MPTrader members who are privy to his visual interpretation of the dominant and secondary trends, the developing risks and rewards, and the emergent opportunities. During the past two weeks, his annotated, detailed chartwork has enabled our members to manage their market expectations and if need be, adjust their individual portfolios.
Mike's regularly updated Daily and Hourly charts (see below) inform MPTrader members several times during each session about the market's progress within his preferred and secondary outlook-- overlaid with macro and fundamental input -- in this case for SPY, but in whatever markets, individual stocks, sector ETFs, macro indices, Bitcoin, precious metals, and commodities he and our members desire to focus on from 8 AM to 5 PM ET.
From the time Mike alerted MPTrader members to the potential risks associated with the Bearish Engulfing Candle (Key Downside Reversal Day) sell signal on April 4, SPY has declined from approximately 515 to last Friday's low at 495.02, or nearly 4%.
What now? With SPY down a total of 6% from the All-Time High, the largest pullback since the 11% correction from July through October 2023, how much more downside is in store, or alternatively, what magnitude of recovery might be approaching?
Login this week to join Mike and our MPTrader members for their intraday brainstorming sessions.

