Big Picture of Gold Remains Promising Technically
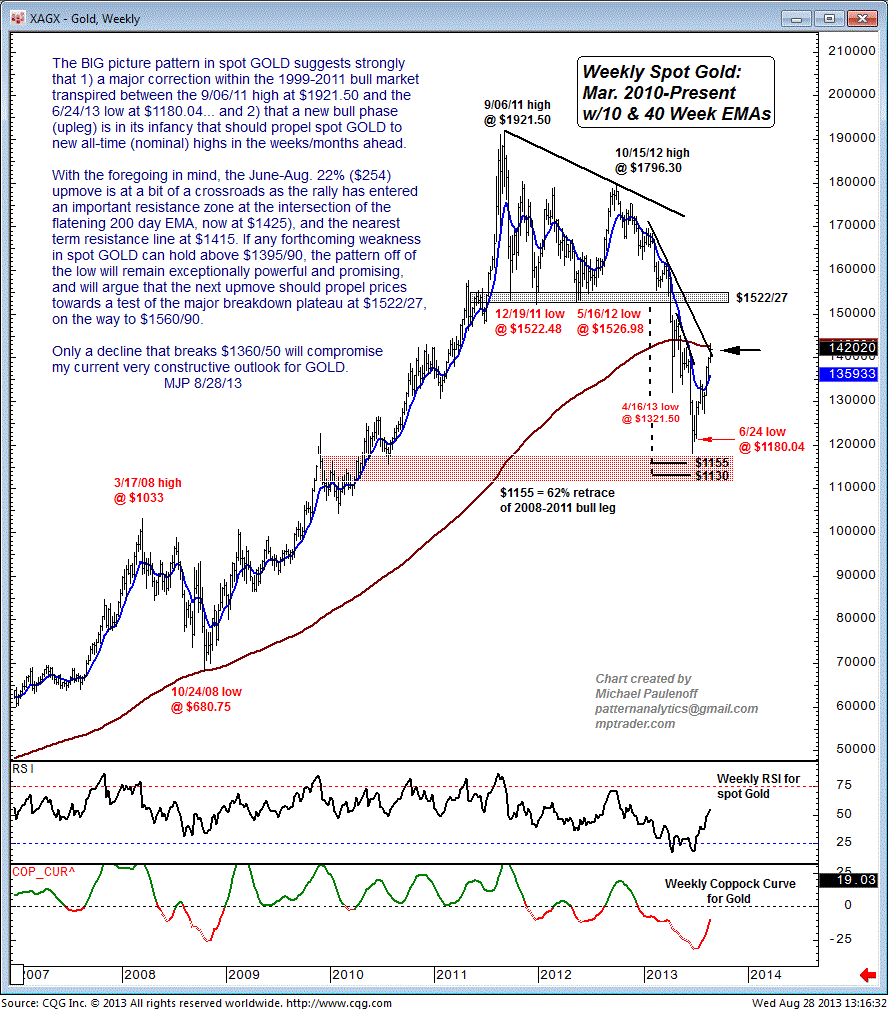
The big-picture pattern in spot Gold suggests strongly that 1) a major correction within the 1999-2011 bull market transpired between the Sept 6, 2011 high at $1921.50 and the June 24, 2013 low at $1180.04, and 2) a new-bull phase upleg is in its infancy that should propel spot Gold to new all-time nominal highs in the weeks/months ahead.
With the foregoing in mind, the June-Aug 22% ($254) upmove is at a bit of a crossroad as the rally has entered an important resistance zone at the intersection of the flattening 200-day EMA, now at $1425, and the nearest-term resistance line at $1415.
If any forthcoming weakness in spot Gold can hold above $1395/90, the pattern off of the low will remain exceptionally powerful and promising, and will argue that the next upmove should propel prices towards a test of the major breakdown plateau at $1522/27, on the way to $1560/90.
Only a decline that breaks $1360/50 will compromise my current very constructive outlook for Gold.

