F and GM are Looking a Bit Toppy
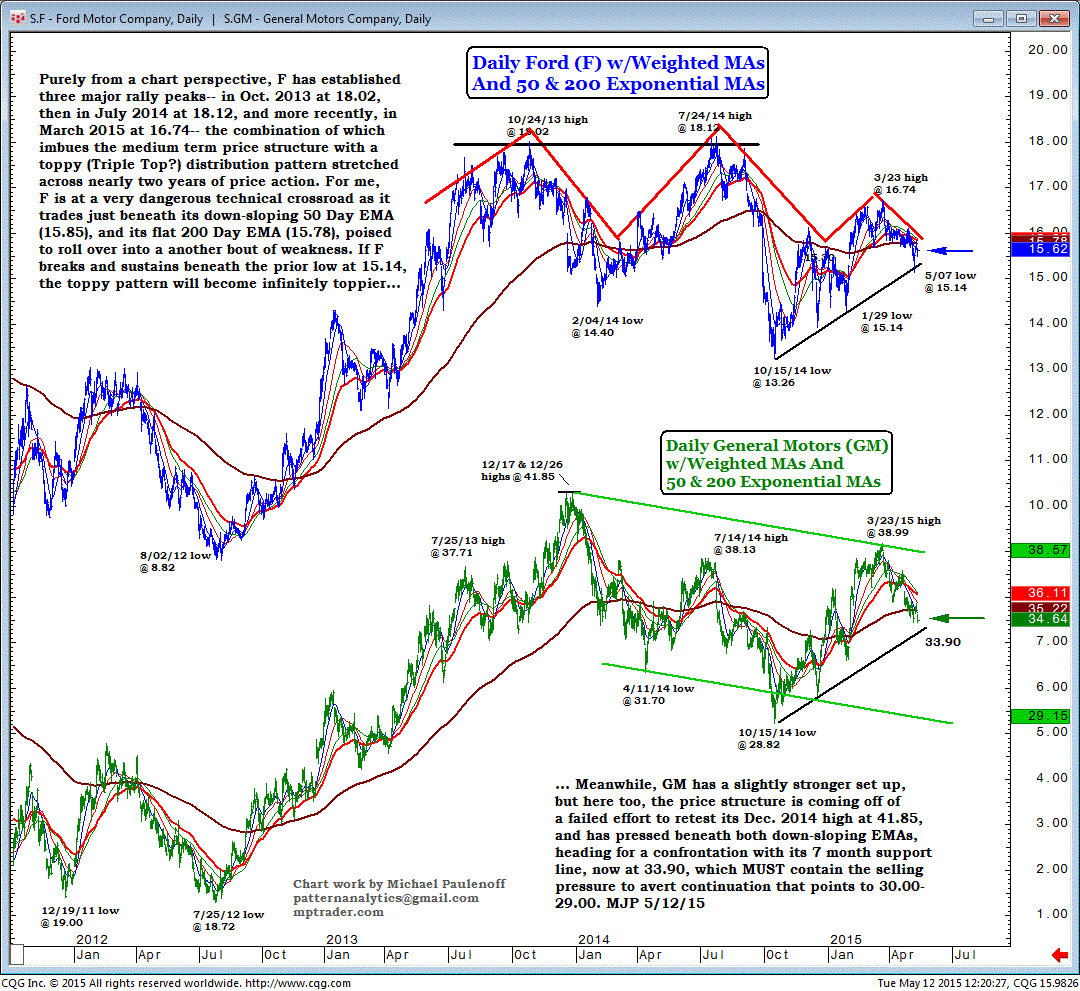
Purely from a chart perspective, Ford Motor Co. (F) has established three major rally peaks-- in Oct 2013 at 18.02, then in July 2014 at 18.12, and more recently, in March 2015 at 16.74-- the combination of which imbues the medium-term price structure with a toppy (Triple Top?) distribution pattern stretched across nearly two years of price action.
For me, F is at a very dangerous, technical crossroad as it trades just beneath its down-sloping 50-Day EMA (15.85), and its flat 200-Day EMA (15.78), poised to roll over into a another bout of weakness.
If F breaks and sustains beneath the prior low at 15.14, the toppy pattern will become infinitely toppier... ...
Meanwhile, General Motors Company (GM) has a slightly stronger set-up, but here too, the price structure is coming off of a failed effort to retest its Dec 2014 high at 41.85, and has pressed beneath both down-sloping EMAs, heading for a confrontation with its 7-month support line, now at 33.90, which must contain the selling pressure to avert continuation that points to 30.00- 29.00.

