S&P in Bullish Coil Pattern

S&P in Bullish Coil Pattern
By Mike Paulenoff, www.MPTrader.com

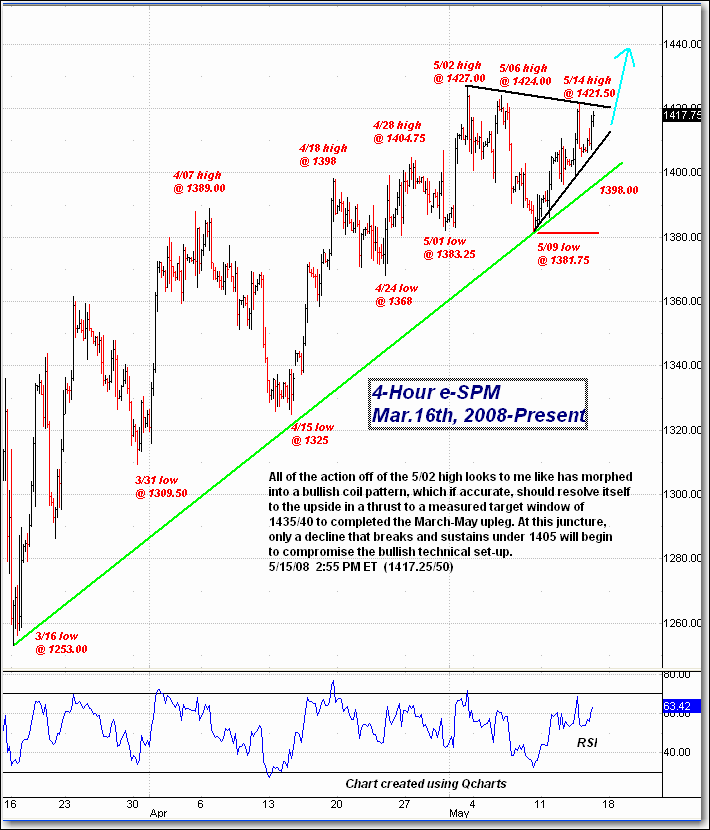
Looking at the S&P 500 and its ETF the SPY via the 4-hour e-Mini S&P chart, we see that all of the action off the May 2 high in the e-Mini S&P appears to have morphed into a bullish coil pattern, which if accurate should resolve itself to the upside in a thrust to a measured target window of 1435/40 to complete the March-May upleg. At this juncture, only a decline that breaks and sustains under 1405 will begin to compromise the bullish technical set-up.

  Matched
x
  • In our live, interactive Trading Room, we identify trading opportunities in ...
  • Equity Index Futures
  • Index & Sector ETFs
  • Individual Stocks
  • Precious Metals
  • Energy
  • Forex
  • Treasuries
  • International Markets
  • And Much More
Join MPTrader Now!
Veteran Wall Street analyst and financial author, Mike provides detailed and timely analysis and trade set-ups on a range of markets. Read more...

Have Mike's “Out Front” morning analysis delivered FREE to your email inbox twice weekly!