ES Near Term Overbought Conditions Versus the Next Round of Positive Headline Risk?
I leave you with two views of ES, 15 Minute and 4 Hours, and both in their own way are warning that the upmove could be exhausted from a near term perspective, net of the next headline-triggering, algo-knee-jerk pop to the upside.
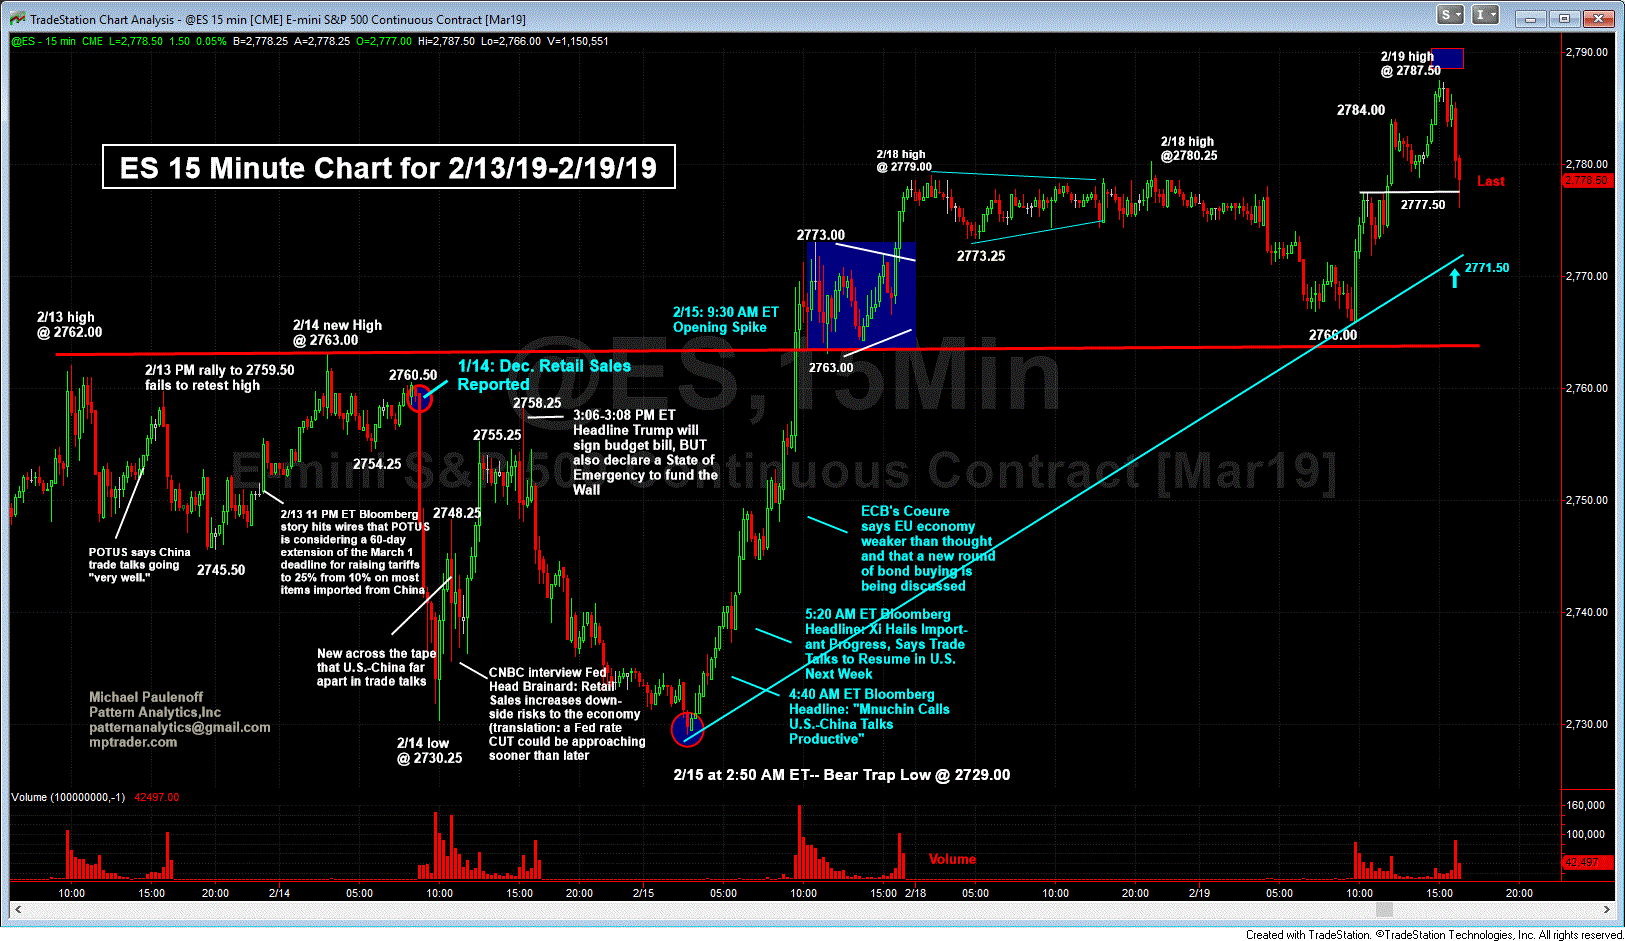
My 15 Minute Chart has the right look of a completed minor upleg from this AM's pre-open pullback low at 2766.00 into this afternoon's high at 2787.50, prior to some long liquidation during the final 30 minutes of futures trading. The very late session decline from 2785 to 2776 is a different and opposite profile of the heretofore bullish intraday profile exhibited by end-of-day jam-jobs most sessions since the December low. From a 15 Minute Chart perspective, all eyes on the 2771/72 area, which represents the support line off of last Friday's wicked middle of the night upside pivot off 2729 ahead of the "contrived" rally all day Friday to 2773.00. The ability of ES to hold 2771/72 will provide us with important information about the health of the nearest term trend.
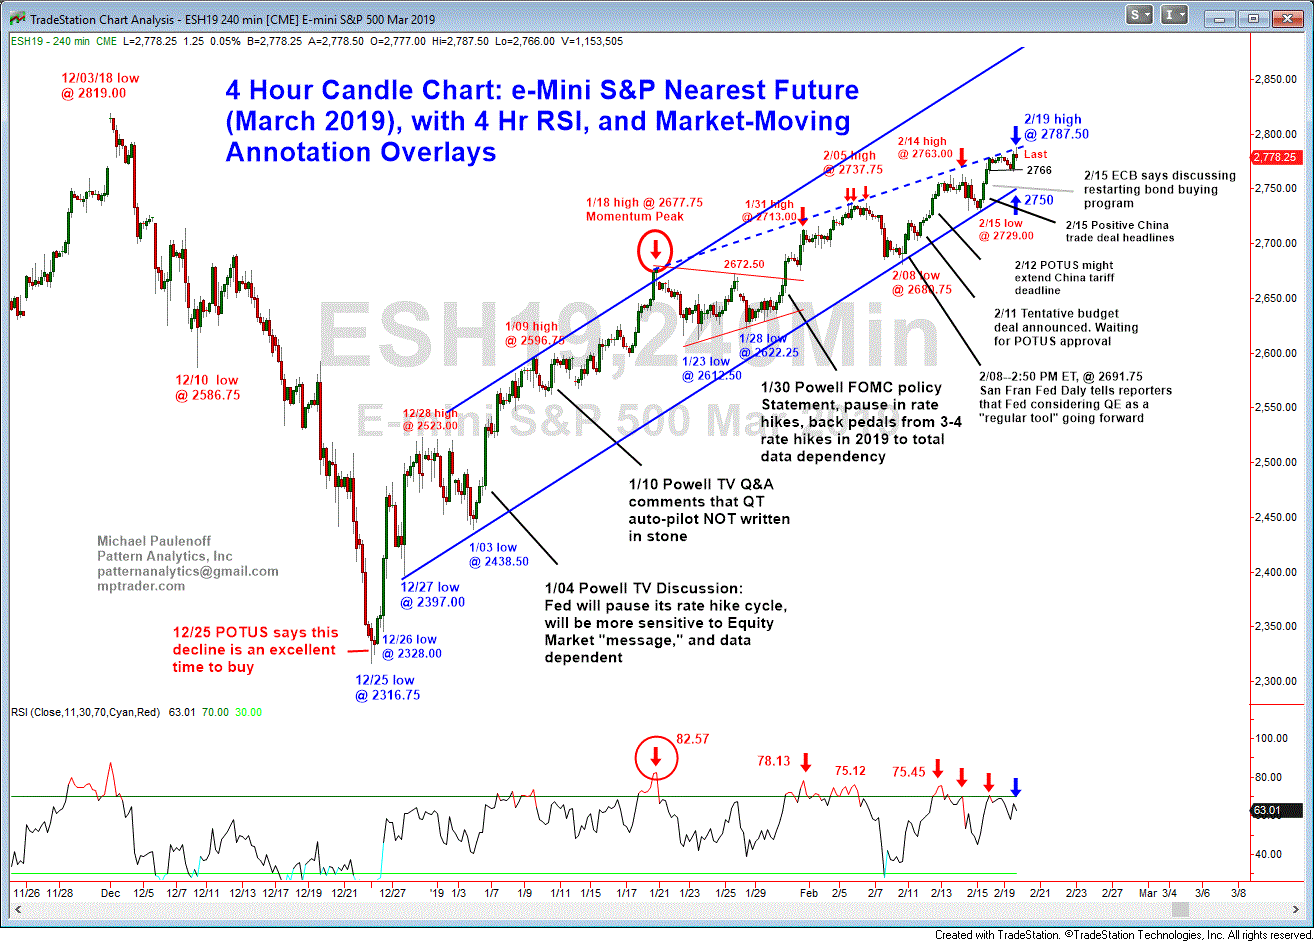
Meanwhile, if we step back to examine the entire December-February advance from 2316.75 to today's high at 2787.50, my RSI Momentum Gauge wants me to interpret the upmove by separating it into two phases: 1) from the 12/24/18 low at 2316.75 to the 1/18/19 high at 2677.75-- all of which was confirmed by upside Momentum, and 2) from the 1/23/19 pullback low at 2612.50 to today's new high-- a series of higher-highs in price (ES), none of which has been confirmed by Momentum.
Granted, each and every time ES has rolled over after the confirmed Momentum high on 1/18/19, the selling pressure has been halted and reversed by positive headlines about Fed interest rate policy and/or promising prospects for a trade deal with China. Be that as it may, not one of the upmoves to a new post-December recovery high has propelled Momentum to a new high.
My sense is that the end-session profile of profit-taking and long liquidation coupled with the growing number of upside negative Price-Momentum divergences are a big warning signal that absent forthcoming positive headlines about a US-China trade deal, the underlying technical set up is treacherous for the benchmark Index. If ES breaks nearest term support (on my 15 Minute Chart) at 2771/72, and then presses beneath 2766.00, we should brace ourselves for a challenge of the Dec.- Feb. up trendline, now in the vicinity of 2750.
If violated, the bulls will be wondering when the next set of bullish headlines will be shoved out of the Fed or the White House or the PBOC?


