IWM/Small Caps Losing Upside Momentum
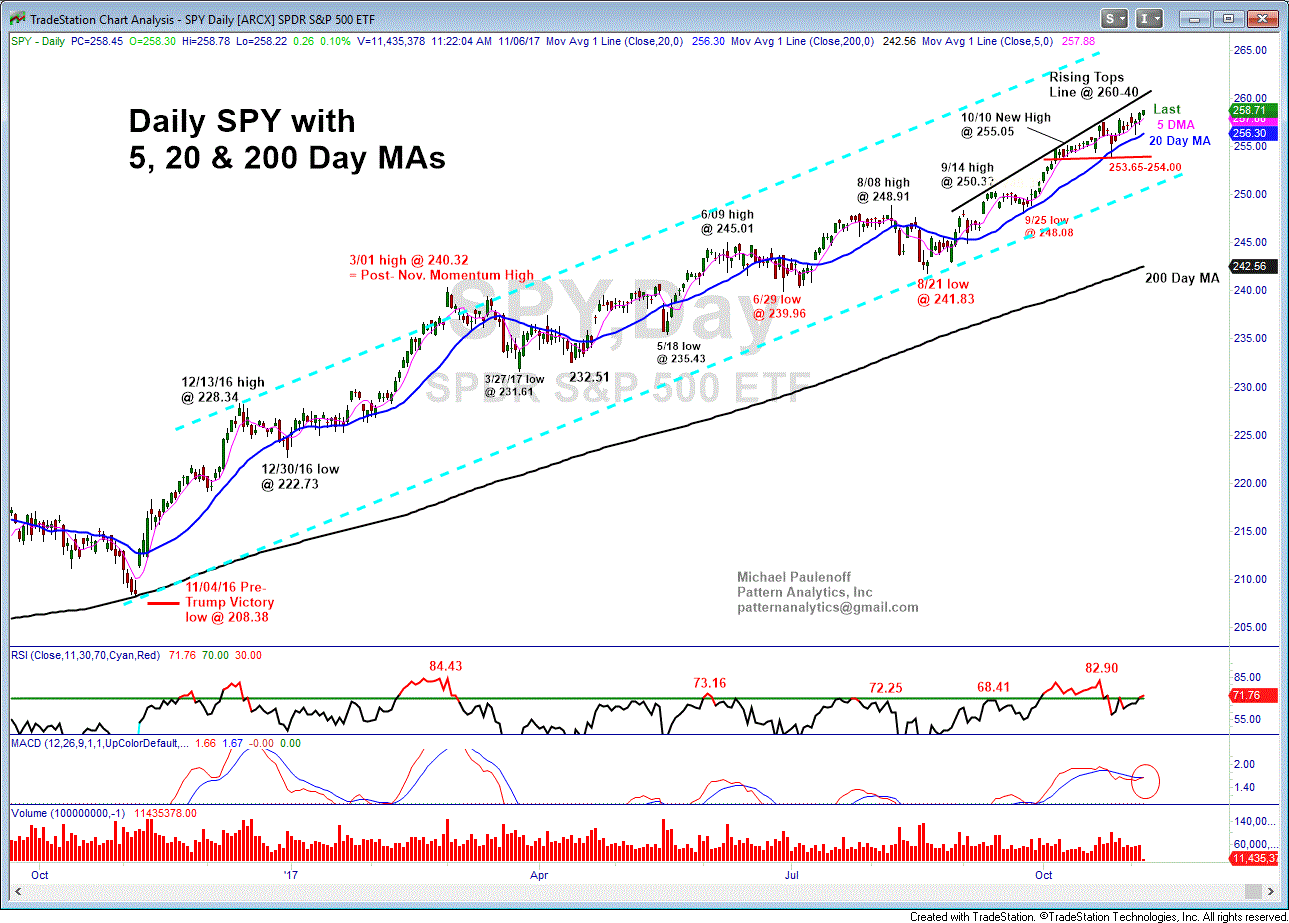
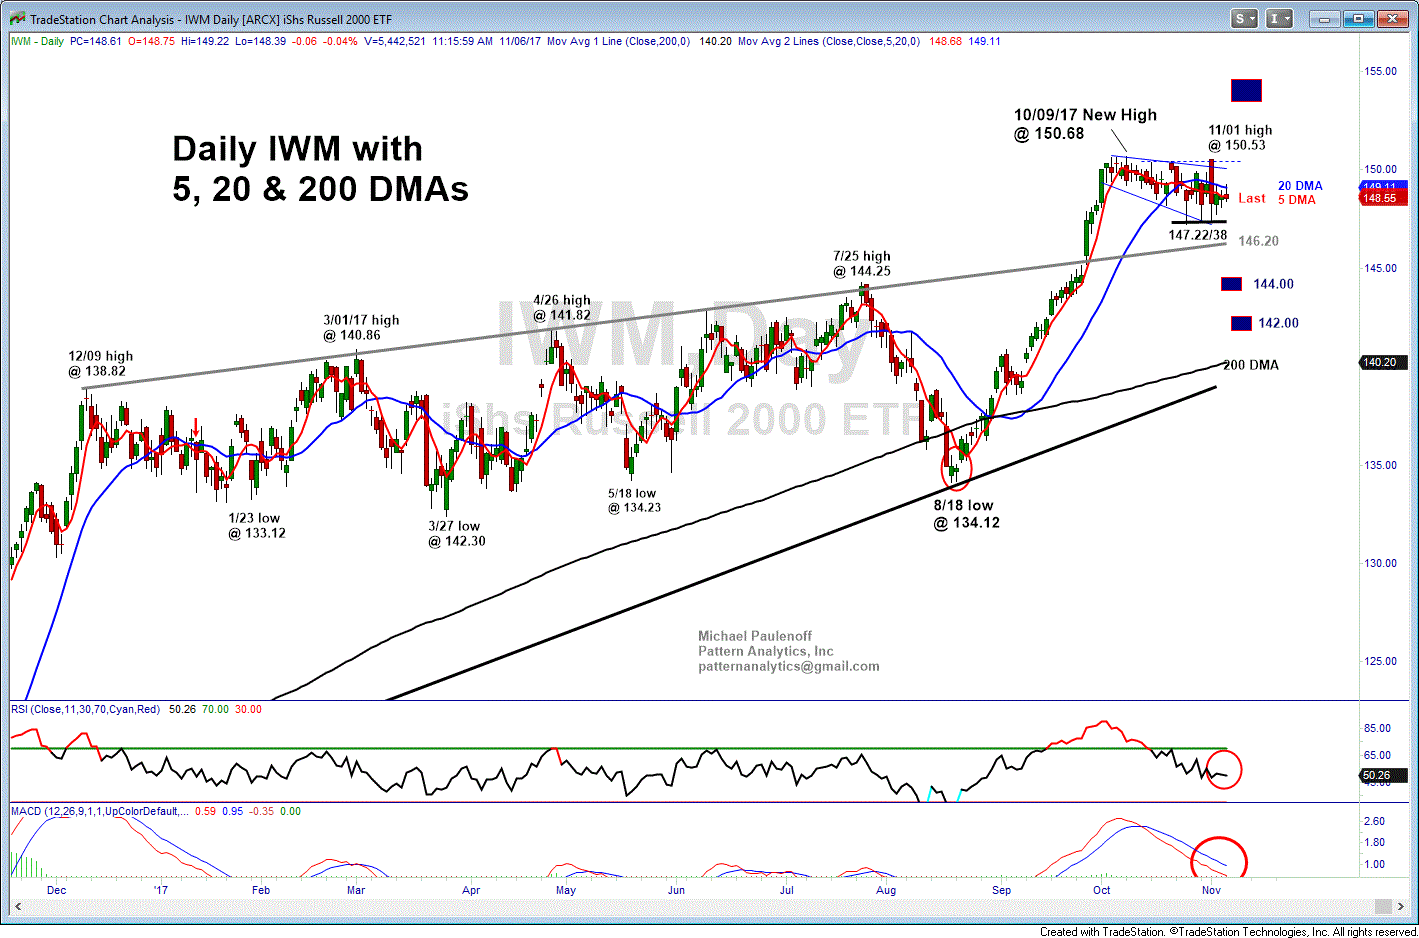
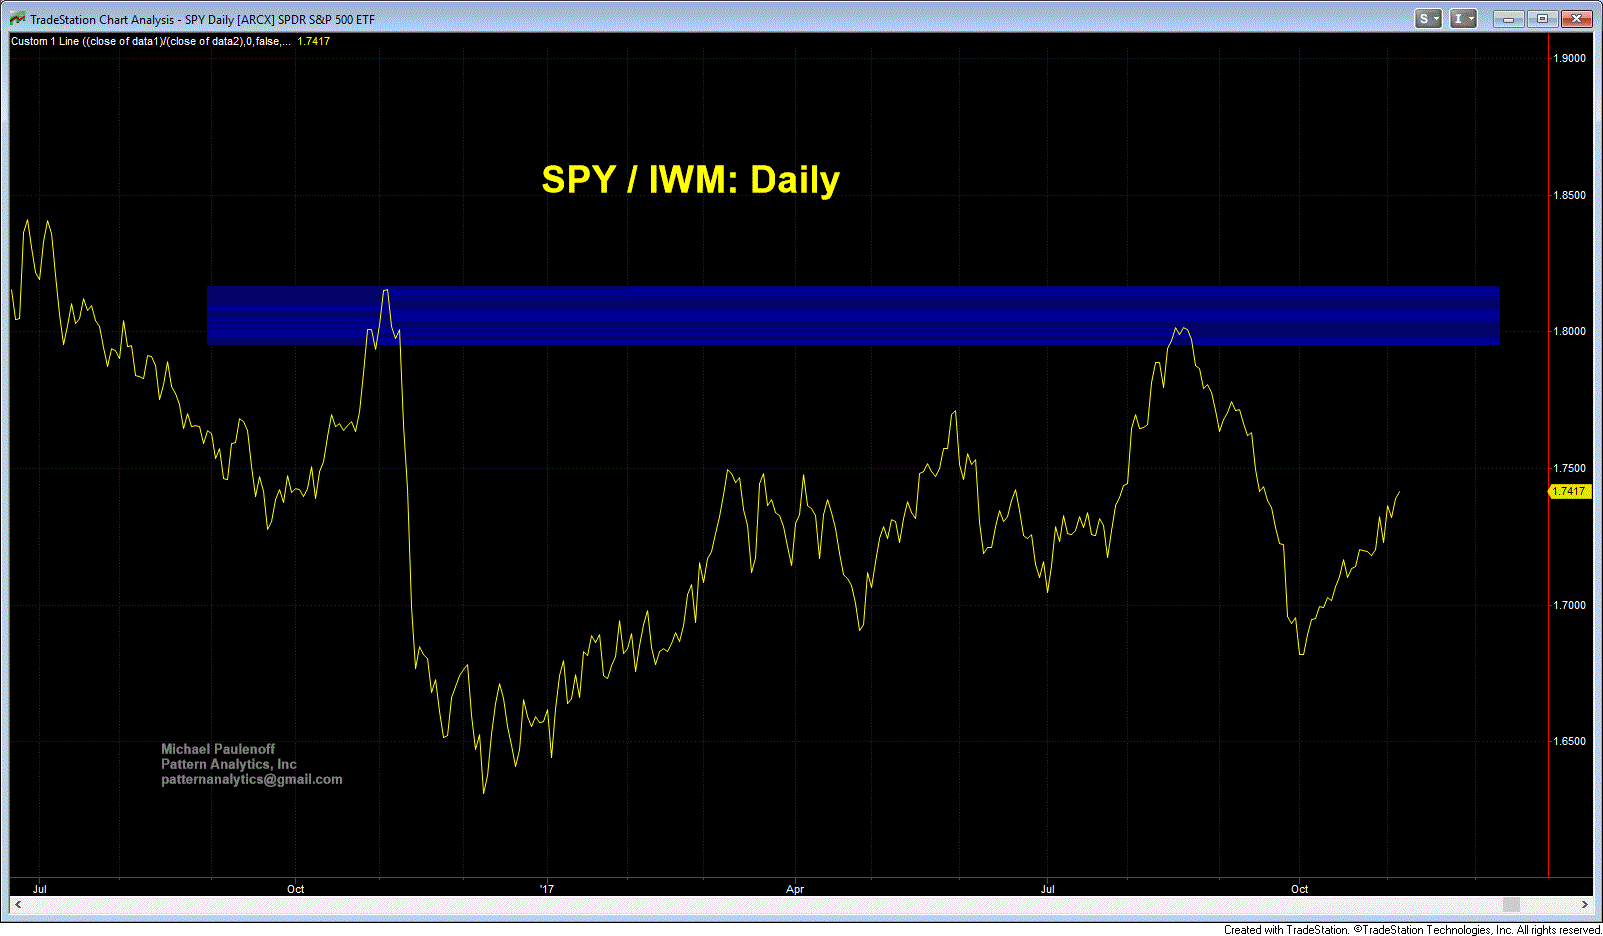
Let's take a look at three big picture set ups: SPY, IWM, and the SPY/IWM Ratio chart, all of which show the deterioration of the Russell Small Cap ETF (IWM) in relation to the Big Cap Spy.
Yes, historically, in the latter stages of a bull move or a bull market, this divergence is very likely, that is, the small companies losing upside momentum relative to the "go-to" mega-capitalized companies.
Whether or not that is the case now, rather than merely a temporary rotation out of IWM in favor of SPY is anyone's guess in this particular market.
From a technical perspective, as long as IWM is trading below its 20 DMA, now at 149.11, I will view it as suspect on the upside, and vulnerable to downside continuation off of its 10/09 all time high at 150.58


