Is DJIA Giving A False Buy Signal?
Monday, December 19, 2022-- Mptrader Pre-Market Update: Let's start the new week (ahead of the Christmas Holiday) with two BIG Picture Chart set ups...
First, the Bullish intermediate-term setup: DJIA
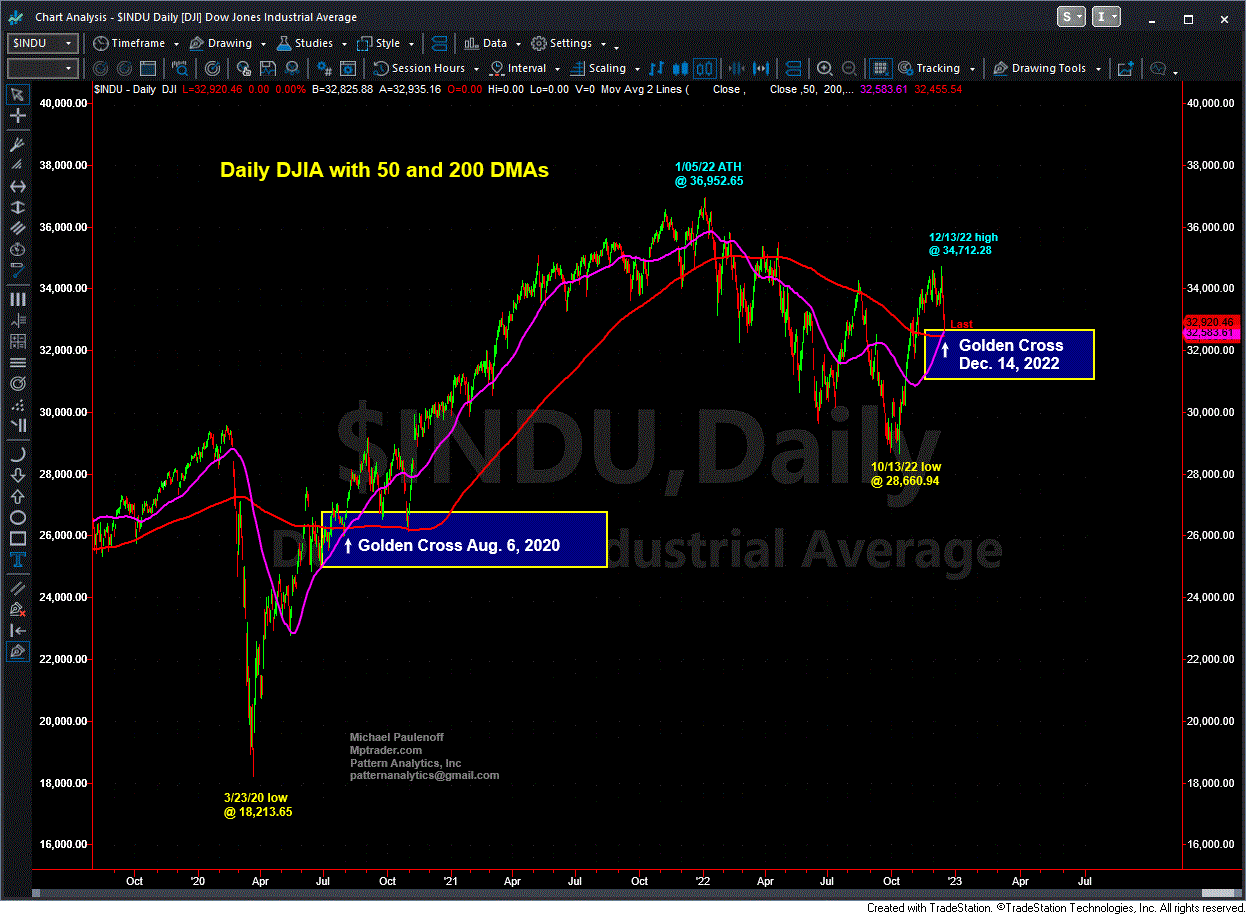
My attached Daily Chart shows that as of last Wednesday's close, the 50 DMA crossed above the 200 DMA, triggering a "Golden Cross buy signal." Believe it or not, the last time the DJIA triggered a Golden Cross was in August 2020, about three months after the Pandemic Low in March 2020.
However, let's keep in mind that the August 2020 Golden Cross was "aided (to put it mildly) by historic Fed liquidity injections to the tune of around $5 Trillion and rapid, large rate cuts. The three-month vertical assault amounted to about a 50% gain in the DJIA to pivot the 50 DMA to the upside for a run above the less dramatic upturn in the 200 DMA.
Fast-forward to 2022, we see the two-month 21% vertical advance from 28,660.94 (10/13/22) to 34,712.28 (12/13/22) has managed to propel the 50 DMA above the 200 DMA, but under MUCH DIFFERENT CIRCUMSTANCES that we can characterize by QT (Quantitative Tightening), a liquidity drain, and a very hawkish and persistent Fed interest rate regime that has watched Fed funds 425 basis points in just 9 months!
Granted, regardless of my interpretation that the QUALITY of this particular Golden Cross signal has a lot to be desired compared with 2020, it is what it IS, and should be regarded as such, perhaps suggesting that the post-Oct. 13 advance is anticipating and forecasting a forthcoming shift in the underlying fundamentals that improves the QUALITY of the current Golden Cross signal. Let's just say that his Golden Cross signal deserves the benefit of the doubt for the time being.
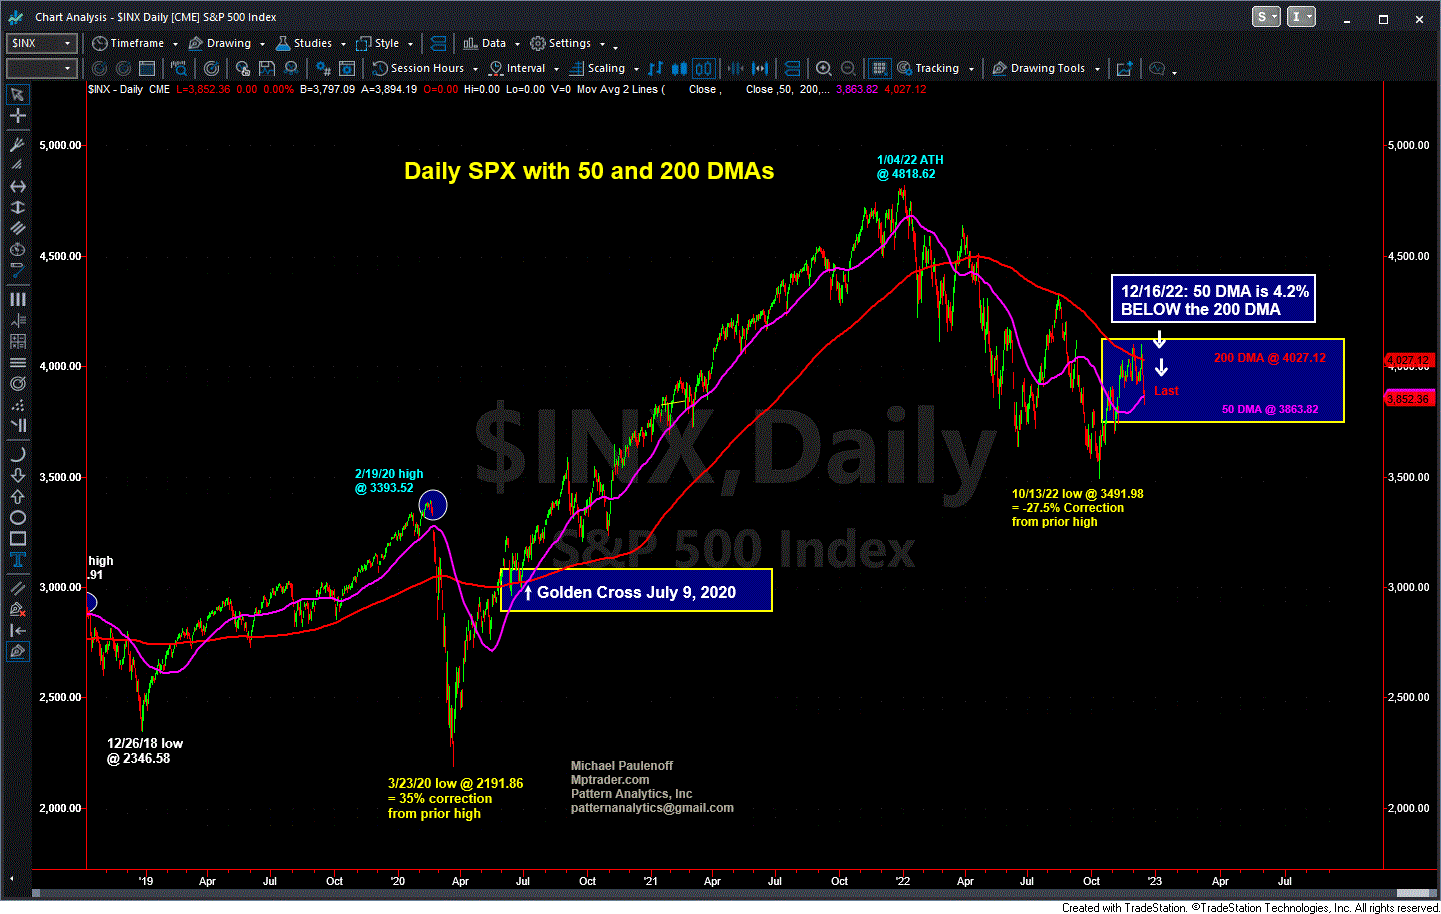
With all of the above in mind about the DJIA technical setup, now let's take a look at my attached Daily Chart setup in the Cash SPX, which has a slightly different tale to tell. As of Friday's close, SPX has NOT triggered a Golden Cross buy signal. In fact, the 50 DMA closed 4.2% beneath the sharply down-sloping 200 DMA, which will take considerable time to narrow-- and requires that SPX remains above the 3920 area in the upcoming days to enable the 50 DMA to continue an upward slope. SPX closed at 3852 on Friday, so it needs to "giddyup" 1.7% higher to increase the likelihood of a Golden Cross in the upcoming 1-2 trading weeks (before year-end).
At the moment, I am not holding my breath for a near-term explosive advance in SPX because my more granular work on ES (SPX futures) is warning me that the downleg off of last week's CPI-FOMC downside reversal still has unfinished business on the downside prior to the next recovery rally (I will post my ES chartwork shortly)...
Where does this divergent Golden Cross analysis leave me? In that the DJIA is a narrow index of 30 "Industrial" names, whereas the SPX reflects a broader snapshot of the largest cap 500 names, I will align my perceptions of a major reversal in market direction with the behavior of the SPX to alert me to a relatively rare buy signal captured by Golden Cross. Right now, as far as I am concerned, the SPX Golden Cross divergence vis-a-vis the DJIA is warning me the SPX remains in the grasp of a 2022 dominant bear trend that likely ended the third recovery rally attempt prior to a resumption of weakness-- and that the DJIA is giving a false buy signal... MJP


