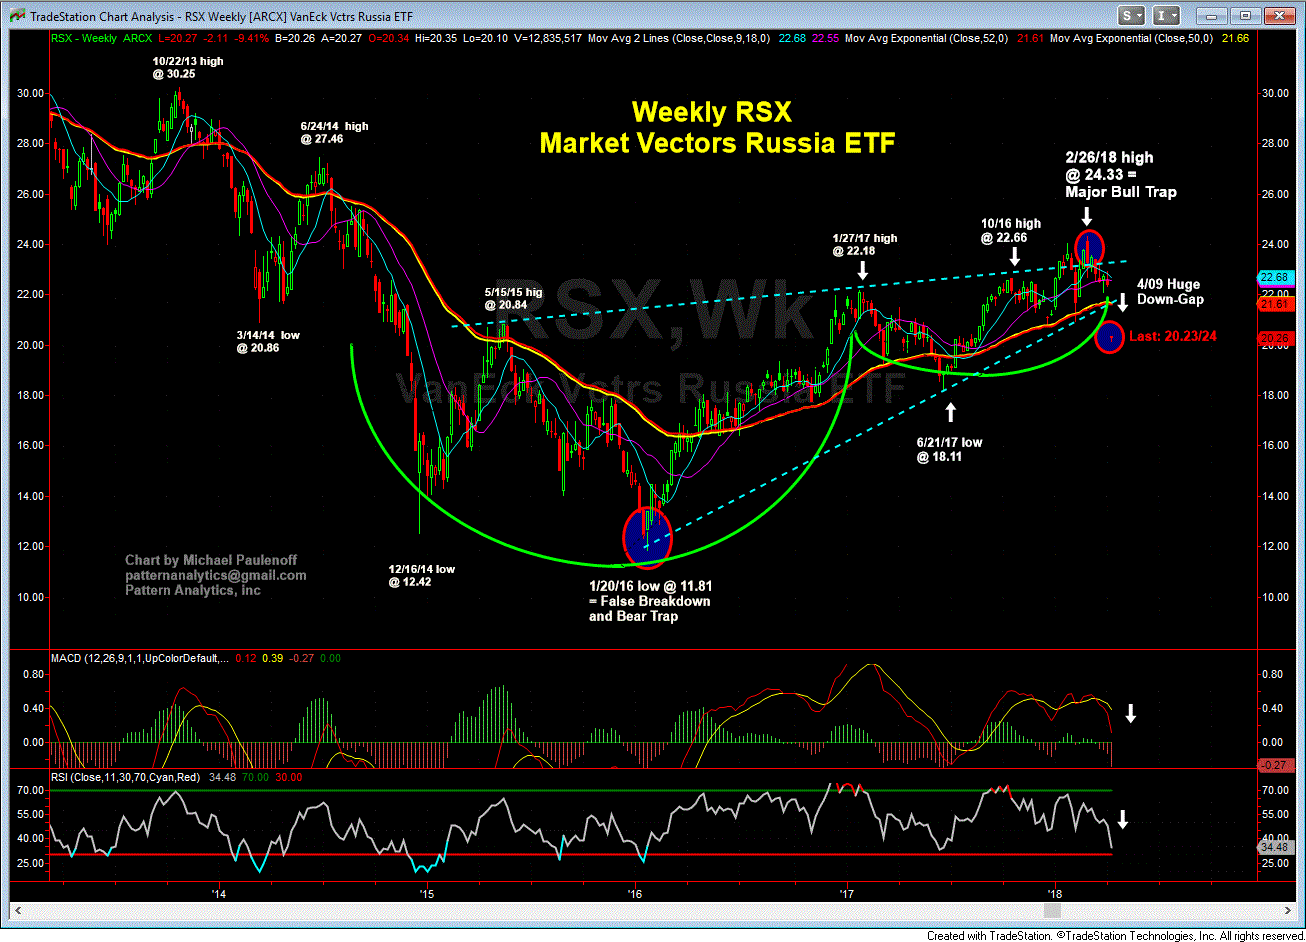
Russia Equity Index ETF (RSX) Nosedives into A Bear Phase
My attached Weekly Chart of RSX (Russia Country Fund, ETF) shows today's 10% down-gap two weeks after a price peak that represented a failed upside breakout from a HUGE 3-1/2 year Cup & Handle Formation.
Today's breakaway down-gap has taken out 7 months of support, and as such has destroyed the aforementioned bullish pattern, and initiates a downleg and a bearish period for the Russia ETF.
Let's keep in mind that the last bearish period for RSX occurred between 2013 and 2016, which coincided with the plunge in Crude Oil from above $115/bbl to under $30/bbl. With oil prices still relatively buoyant around $65/bbl, up from $26/bbl in 2016, the major breakdown in RSX suggests something else could be or already is, impacting Russia.
Whether or not the action in RSX reflects some degree of Russia geopolitical risk, or impending decline in oil prices (RSX is heavily weighted with Oil Companies) remains to be seen, but if I had to guess, RSX presents a potentially very negative image of Russian equity market action that implies underlying instability that could have some domino effects if downside acceleration persists.
We need to continue to watch RSX with interest in the days ahead... Last is 20.40/41

