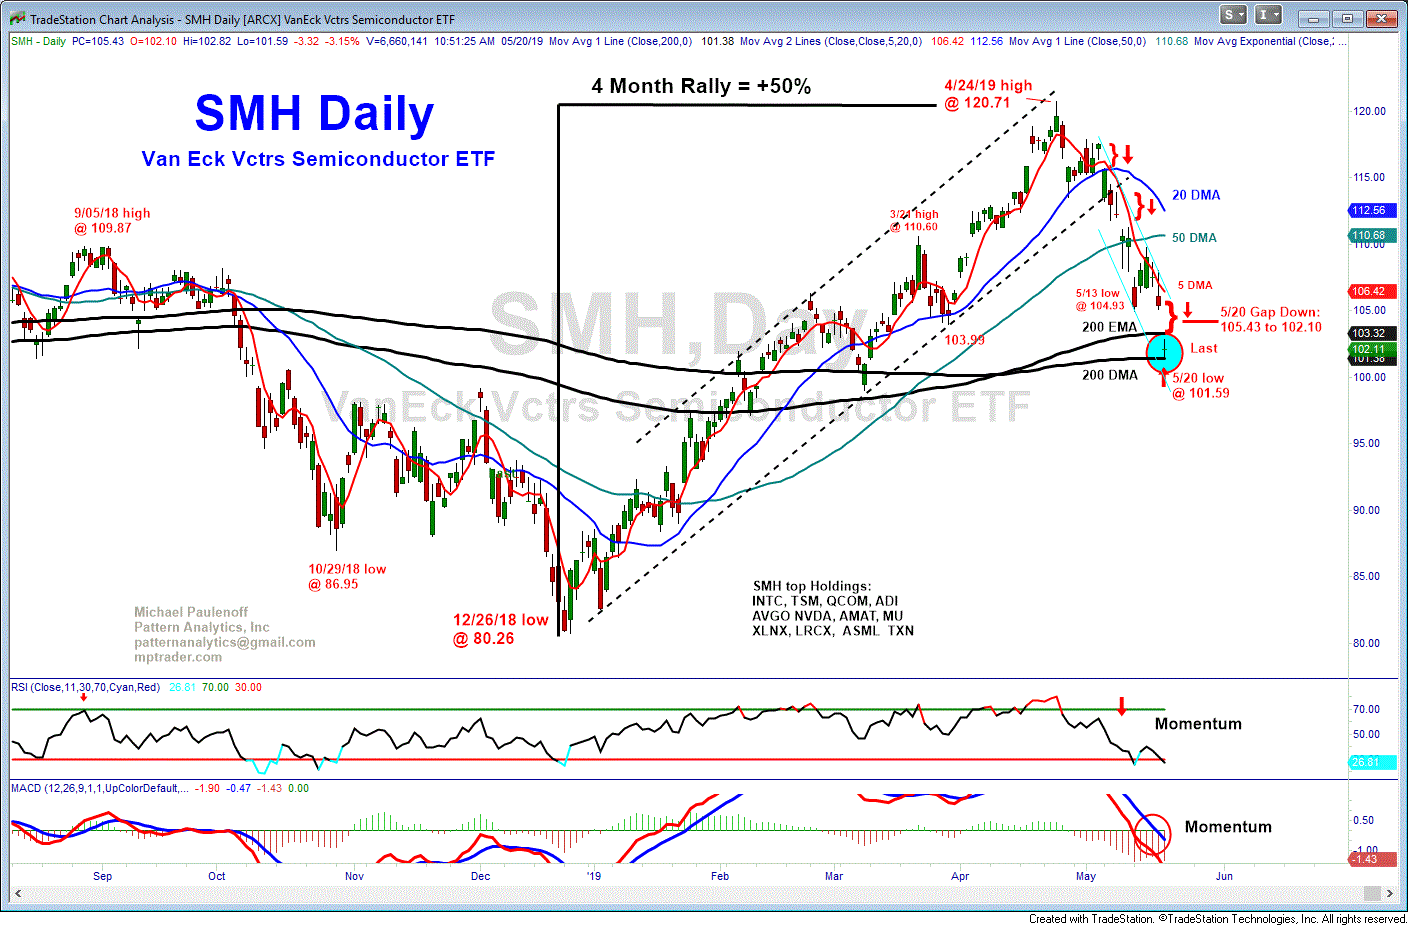
SMH Follows My Bearish Technical Script
SMH (Semiconductor ETF) opened down 3.2% this morning, leaving behind a wide down-gap from 105.43 to 102.10. After the open, SMH pressed still-lower to an intraday low at 101.59, which we see fully tested the slightly down-sloping 200 DMA, now at 101.38. So far, the 200 DMA has contained today's weakness within a larger correction of 15.8% off of the 4/24/19 high.
Also shown on the attached Daily Chart is the Exponential 200 DMA, now at 103.32, and which represents MA resistance on any recovery rally attempt. So far today, SMH has recovered from 101.59 to 102.82, but only has closed 22% of its opening down-gap, suggesting that buying pressure so far is relatively feeble. Inability of SMH to claw its way to 103.77 to close half the opening down-gap, which also will challenge and hurdle the 200 Day EMA will leave the Semiconductor ETF vulnerable to downside continuation that breaks the 200 Day (Simple) MA (101.32) in route to my next optimal downside target zone of 100.40 to 99.70.
Bottom Line: SMH needs to take out 103.30/80 to trigger preliminary signals that a nearest term low has been established, however, in the absence of such "strength," SMH points to 100.40 to 99.70... Last is 102.00/01

