The Russell 2000 Small Cap ETF Appears To Be on Shaky Technical Ground
 By
Mike Paulenoff
By
Mike Paulenoff
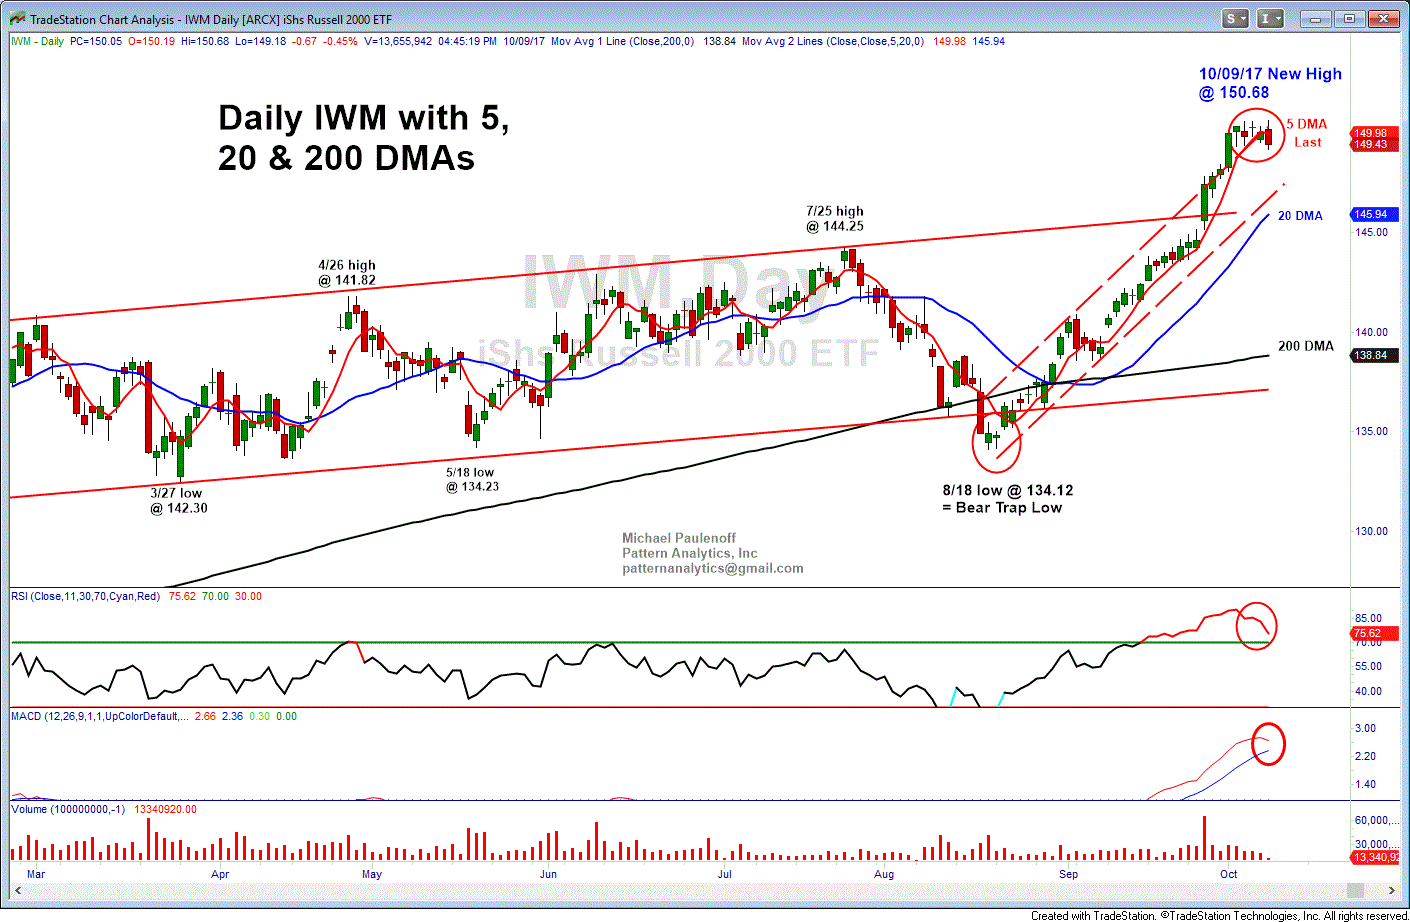
I leave you tonight with a final look at my IWM daily chart, which shows that the Russell Small Cap Index ETF made a marginal new all-time high at 150.68 this morning, but then pivoted to the downside to close at 149.43. While the intraday decline amounted to an unremarkable 0.8%, let's notice that it represented a Key Downside Reversal Day and a day of weakness that also took out all four prior trading days as well.
As I see today's action in IWM, it initially failed to follow-through on the upside after making a new all time high, and then reversed to the downside to take out the prior four days of trading in what has to be labeled a potentially important distribution session.
Tomorrow's action could provide a lot of information about the near term health of the IWM...
Have a great evening everyone... MJP