10-Year Treasury YIELD Awaits Next Week's Fed Meeting
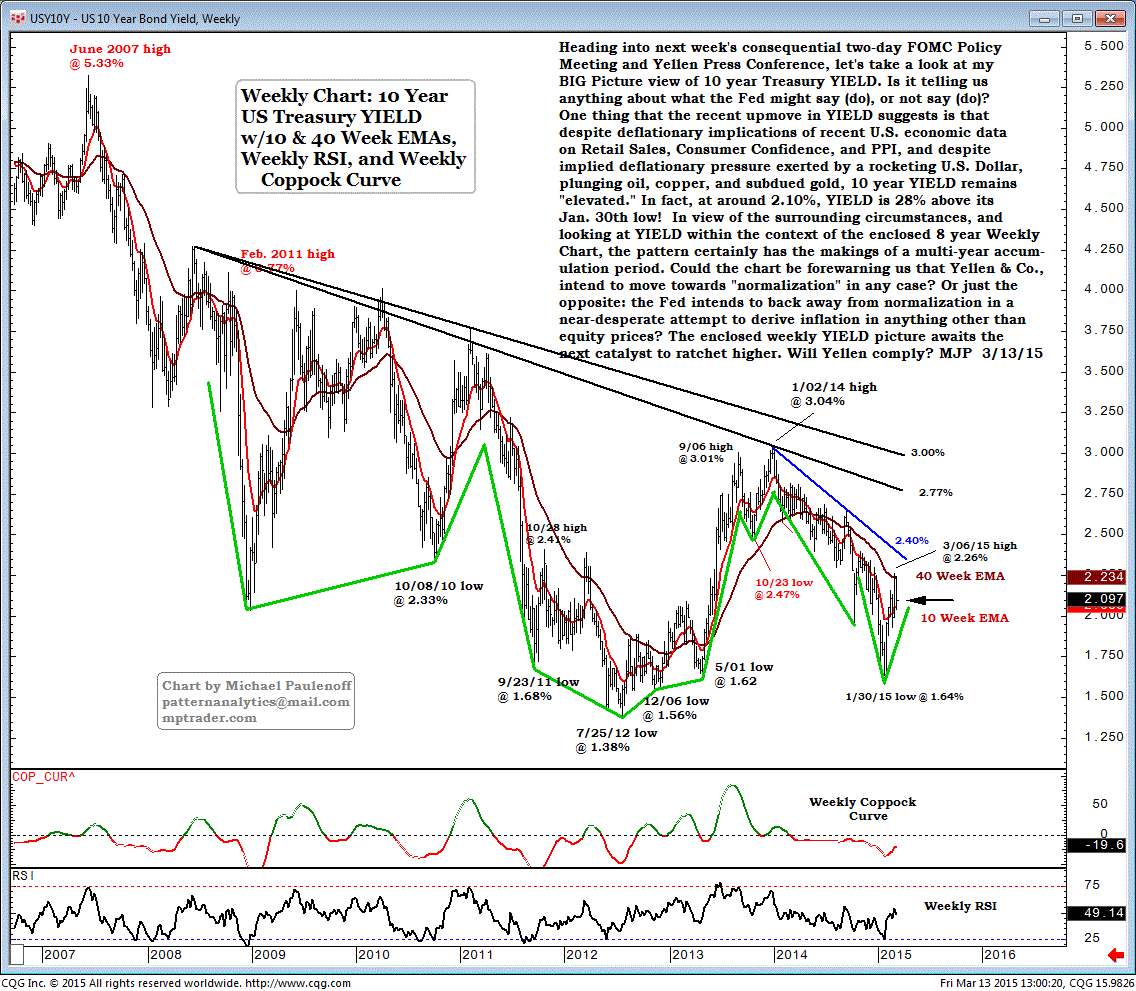
Heading into next week's consequential two-day FOMC Policy Meeting and Yellen Press Conference, let's take a look at my big picture view of 10-year Treasury YIELD.
Is it telling us anything about what the Fed might say (do), or not say (do)?
One thing that the recent upmove in YIELD suggests is that despite deflationary implications of recent U.S. economic data on Retail Sales, Consumer Confidence, and PPI, and despite implied deflationary pressure exerted by a rocketing U.S. Dollar, plunging oil, copper, and subdued gold, 10-year YIELD remains "elevated."
In fact, at around 2.10%, YIELD is 28% above its Jan 30 low!
In view of the surrounding circumstances, and looking at YIELD within the context of the enclosed 8-year weekly chart, the pattern certainly has the makings of a multi-year accumulation period.
Could the chart be forewarning us that Yellen & Co. intend to move towards "normalization" in any case?
Or just the opposite: the Fed intends to back away from normalization in a near-desperate attempt to derive inflation in anything other than equity prices?
The enclosed weekly YIELD picture awaits the next catalyst to ratchet higher.
Will Yellen comply?

