10-Year T-Bond YIELD Poised for Another Upleg
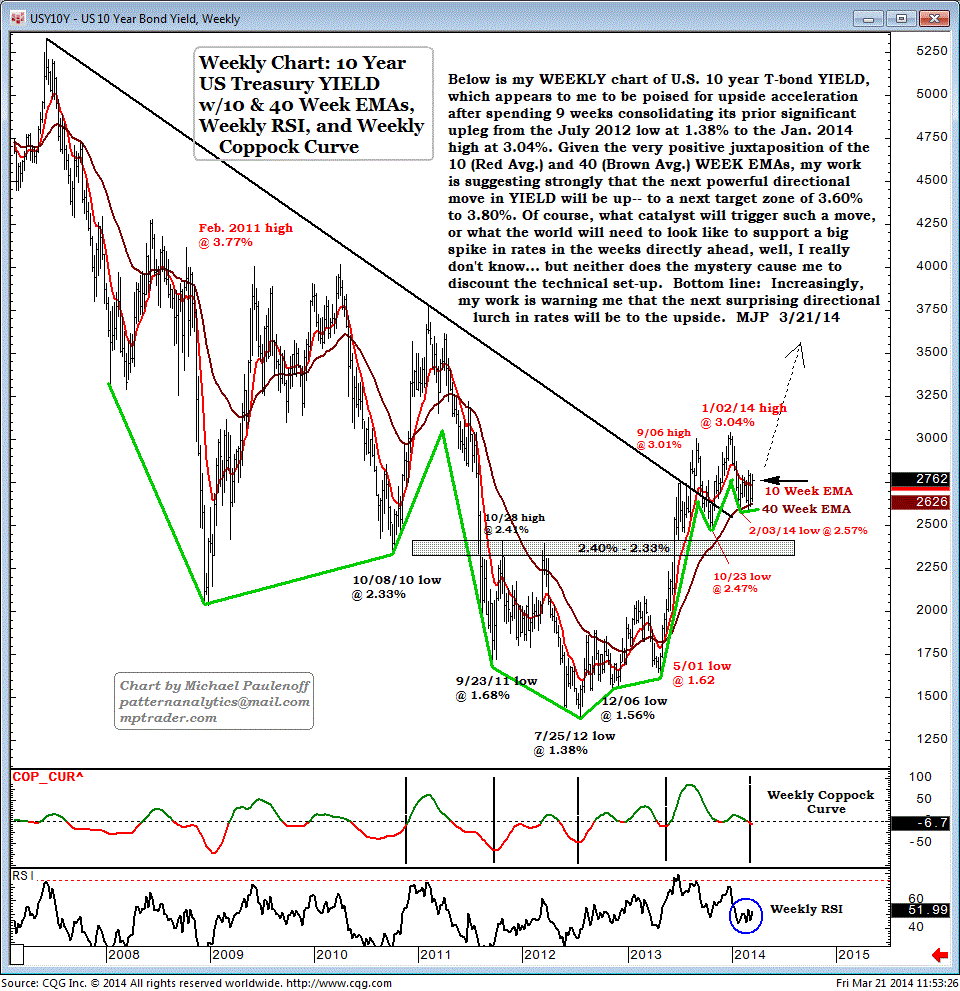
Below is my weekly chart of US 10-year T-bond Yield, which appears to me to be poised for upside acceleration after spending 9 weeks consolidating its prior significant upleg from the July 2012 low at 1.38% to the Jan 2014 high at 3.04%.
Given the very positive juxtaposition of the 10 (Red Avg.) and 40 (Brown Avg.) week EMAs, my work is suggesting strongly that the next powerful directional move in Yield will be up to a next target zone of 3.60% to 3.80%.
Of course, what catalyst will trigger such a move, or what the world will need to look like to support a big spike in rates in the weeks directly ahead, well, I really don't know... but neither does the mystery cause me to discount the technical set-up.
Bottom line: Increasingly, my work is warning me that the next surprising directional lurch in rates will be to the upside.

