
Market Analysis for Jan 27th, 2005
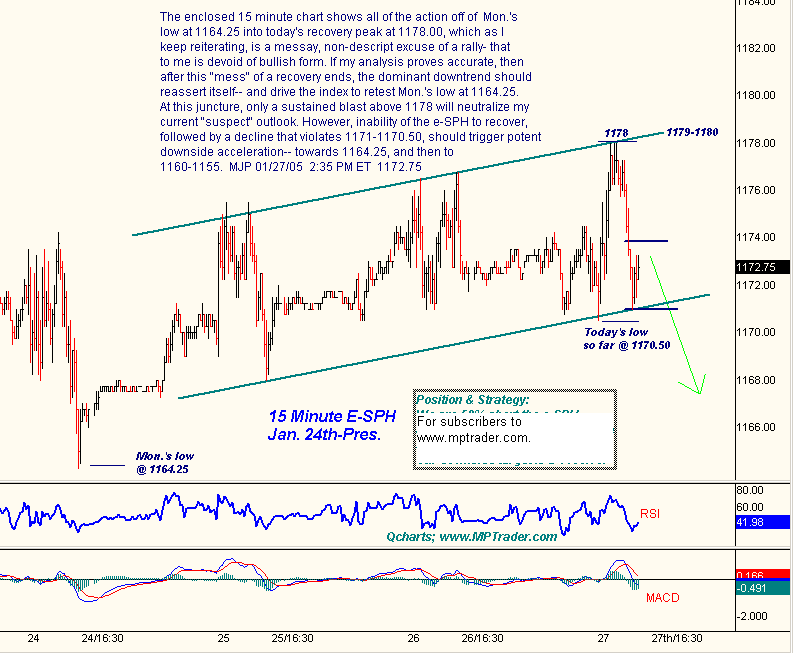
The 15-minute chart on the E-mini March S&P shows all the action off of Monday's low at 1164.25 into today's recovery peak at 1178, which as I keep reiterating to my subscribers is a messy, non-descript excuse of a rally that to me is devoid of bullish form. If my analysis proves accurate, then after this "mess" of a recovery ends, the dominant downtrend should reassert itself -- and drive the index to retest Monday's low at 1164.25. At this juncture, only a sustained blast above 1178 will neutralize my current "suspect" outlook. However, inability of the e-SPH to recover, followed by a decline that violates 1171-1170.50, should trigger potent downside acceleration -- towards 1164.25 and then to 1160-1155.
For more of Mike Paulenoff, sign up for a FREE 30-Day Trial to his E-Mini/Index Futures diary at. Or try his QQQ Trading Diary.