Market Analysis for Feb 23rd, 2005
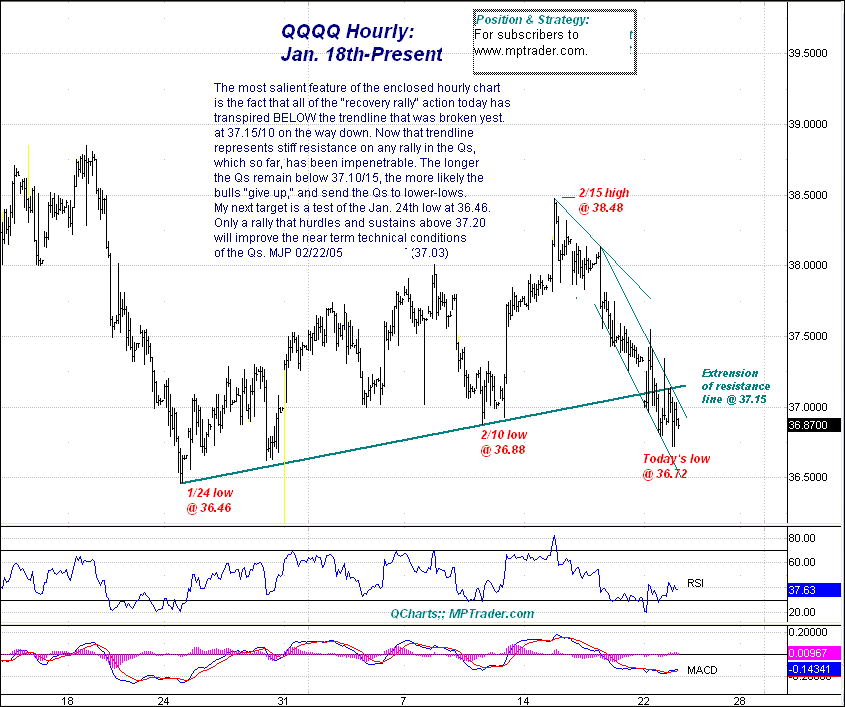
The most salient feature of the enclosed hourly chart is the fact that all of the "recovery rally" action today has transpired BELOW the trendline that was broken yesterday at 37.15/.10 on the way down. Now that trendline represents stiff resistance on any rally in the QQQQ, which so far has been impenetrable. The longer the Qs remain below 37.10-.15, the more likely the bulls "give up" and send the Qs to lower lows. My next target is a test of the January 24th low at 36.46. Only a rally that hurdles and sustains above 37.20 will improve the near-term technical conditions of the Qs.
For more of Mike Paulenoff, sign up for a FREE 30-Day Trial to his E-Mini/Index Futures diary at. Or try his QQQ Trading Diary.

