Market Analysis for Mar 17th, 2005
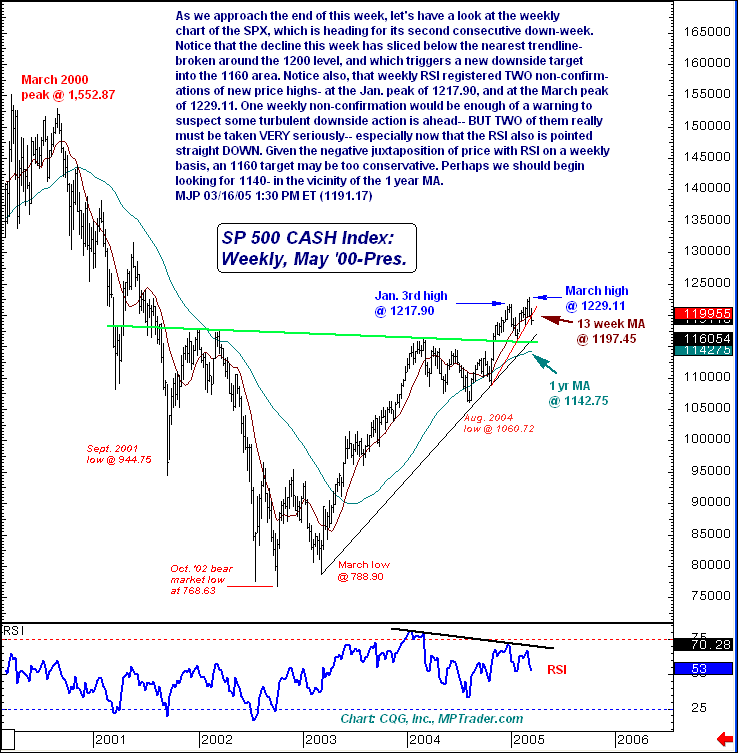
For today's Mid-Day Minute, Mike writes: As we approach the end of this week, let's have a look at the weekly
chart of the SPX, which is heading for its second consecutive down-week.
Notice that the decline this week has sliced below the nearest trendline-
broken around the 1200 level, and which triggers a new downside target
into the 1160 area. Notice also, that weekly RSI registered TWO non-confirm-
ations of new price highs- at the Jan. peak of 1217.90, and at the March peak
of 1229.11. One weekly non-confirmation would be enough of a warning to
suspect some turbulent downside action is ahead-- BUT TWO of them really
must be taken VERY seriously-- especially now that the RSI also is pointed
straight DOWN. Given the negative juxtaposition of price with RSI on a weekly
basis, an 1160 target may be too conservative. Perhaps we should begin
looking for 1140- in the vicinity of the 1 year MA.
MJP 03/16/05 1:30 PM ET (1191.17)
For more of Mike Paulenoff, sign up for a FREE 30-Day Trial to his E-Mini/Index Futures diary. Or try his QQQ Trading Diary.

