
Market Analysis for May 17th, 2005
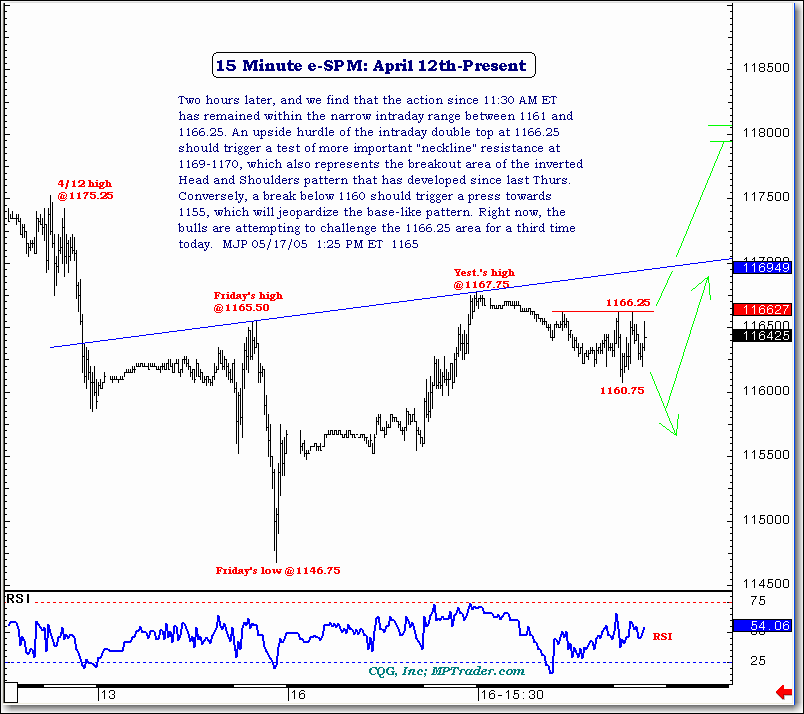
Two hours later, and we find that the action since 11:30 AM ET
has remained within the narrow intraday range between 1161 and
1166.25 on the June E-mini S&P. An upside hurdle of the intraday double top at 1166.25
should trigger a test of more important "neckline" resistance at
1169-1170, which also represents the breakout area of the inverted
Head and Shoulders pattern that has developed since last Thurs.
Conversely, a break below 1160 should trigger a press towards
1155, which will jeopardize the base-like pattern. Right now, the
bulls are attempting to challenge the 1166.25 area for a third time
today. MJP 05/17/05 1:25 PM ET 1165
For more of Mike Paulenoff, sign up for a FREE 30-Day Trial to his E-Mini/Index Futures diary. Or try his QQQ Trading Diary.