Market Analysis for Jun 23rd, 2005
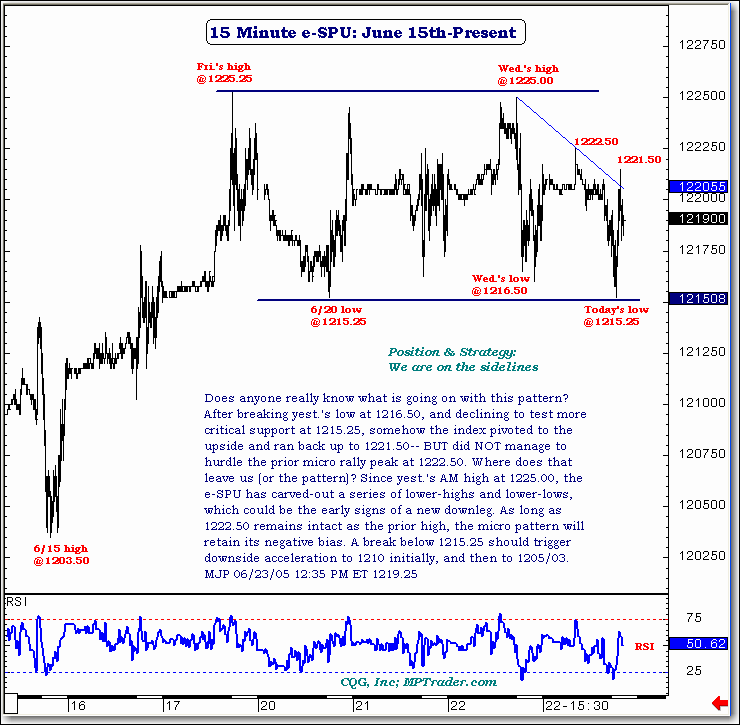
Does anyone really know what is going on with this pattern?
After breaking yest.'s low at 1216.50, and declining to test more
critical support at 1215.25, somehow the index pivoted to the
upside and ran back up to 1221.50-- BUT did NOT manage to
hurdle the prior micro rally peak at 1222.50. Where does that
leave us (or the pattern)? Since yest.'s AM high at 1225.00, the
e-SPU has carved-out a series of lower-highs and lower-lows,
which could be the early signs of a new downleg. As long as
1222.50 remains intact as the prior high, the micro pattern will
retain its negative bias. A break below 1215.25 should trigger
downside acceleration to 1210 initially, and then to 1205/03. This will be our last Mid-Day Minute until Monday. Have a great weekend!
For more of Mike Paulenoff, sign up for a FREE 30-Day Trial to his E-Mini/Index Futures diary. Or try his QQQ Trading Diary.

