Market Analysis for Oct 6th, 2005
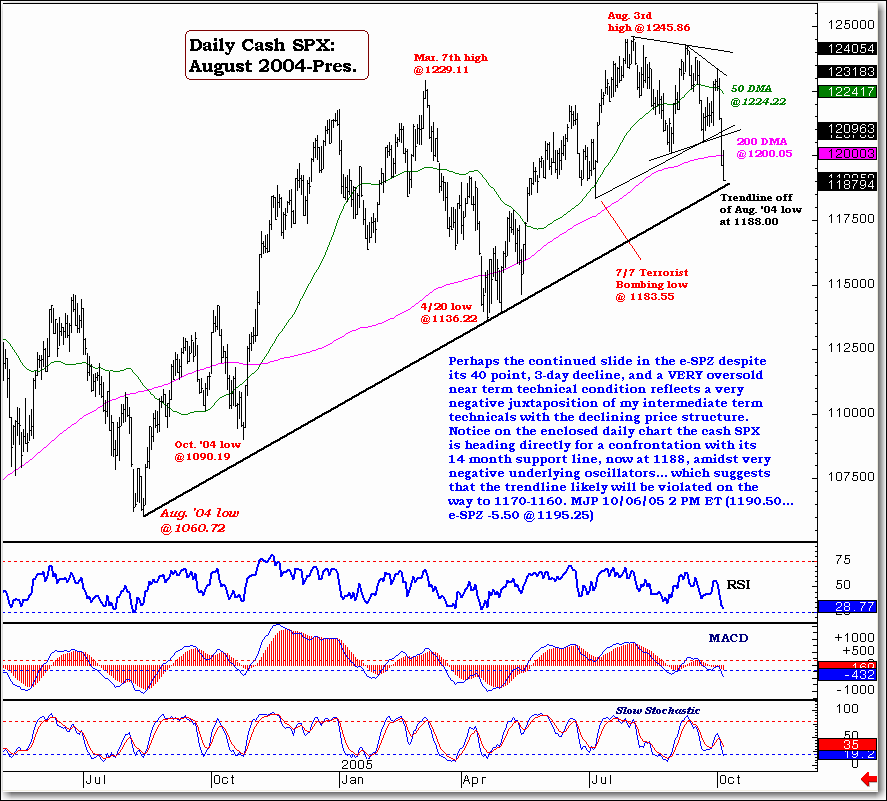
Perhaps the continued slide in the e-SPZ despite
its 40 point, 3-day decline, and a VERY oversold
near term technical condition reflects a very
negative juxtaposition of my intermediate term
technicals with the declining price structure.
Notice on the enclosed daily chart the cash SPX
is heading directly for a confrontation with its
14 month support line, now at 1188, amidst very
negative underlying oscillators... which suggests
that the trendline likely will be violated on the
way to 1170-1160. MJP 10/06/05 2 PM ET (1190.50...
e-SPZ -5.50 @ 1195.25)
For more of Mike Paulenoff, sign up for a FREE 30-Day Trial to his E-Mini/Index Futures diary. Or try his QQQ Trading Diary.

