A Developing Ugly Pattern in the SPX
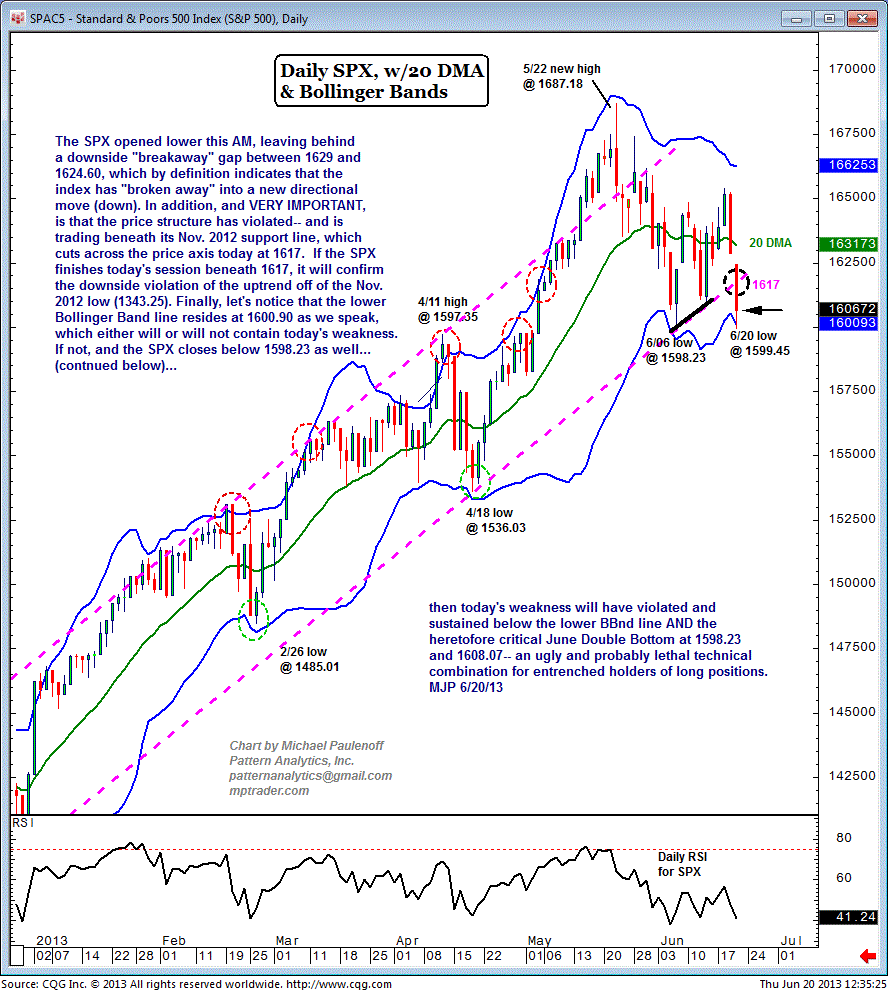
The S&P 500 Index (SPX) opened lower this morning, leaving behind a downside "breakaway" gap between 1629 and 1624.60, which by definition indicates that the index has "broken away" into a new directional move down.
In addition, and very important, is that the price structure has violated and is trading beneath its Nov 2012 support line, which cuts across the price axis today at 1617.
If the S&P 500 Index (SPX) finishes today's session beneath 1617, it will confirm the downside violation of the uptrend off of the Nov 2012 low at 1343.25.
Finally, let's notice that the lower Bollinger Band line resides at 1600.90 as we speak, which either will or will not contain today's weakness.
If not, and the SPX closes below 1598.23 as well, then today's weakness will have violated and sustained below the lower Bollinger Band line as well as and the heretofore critical June double bottom at 1598.23 and 1608.07 -- an ugly and probably lethal technical combination for entrenched holders of long positions.

