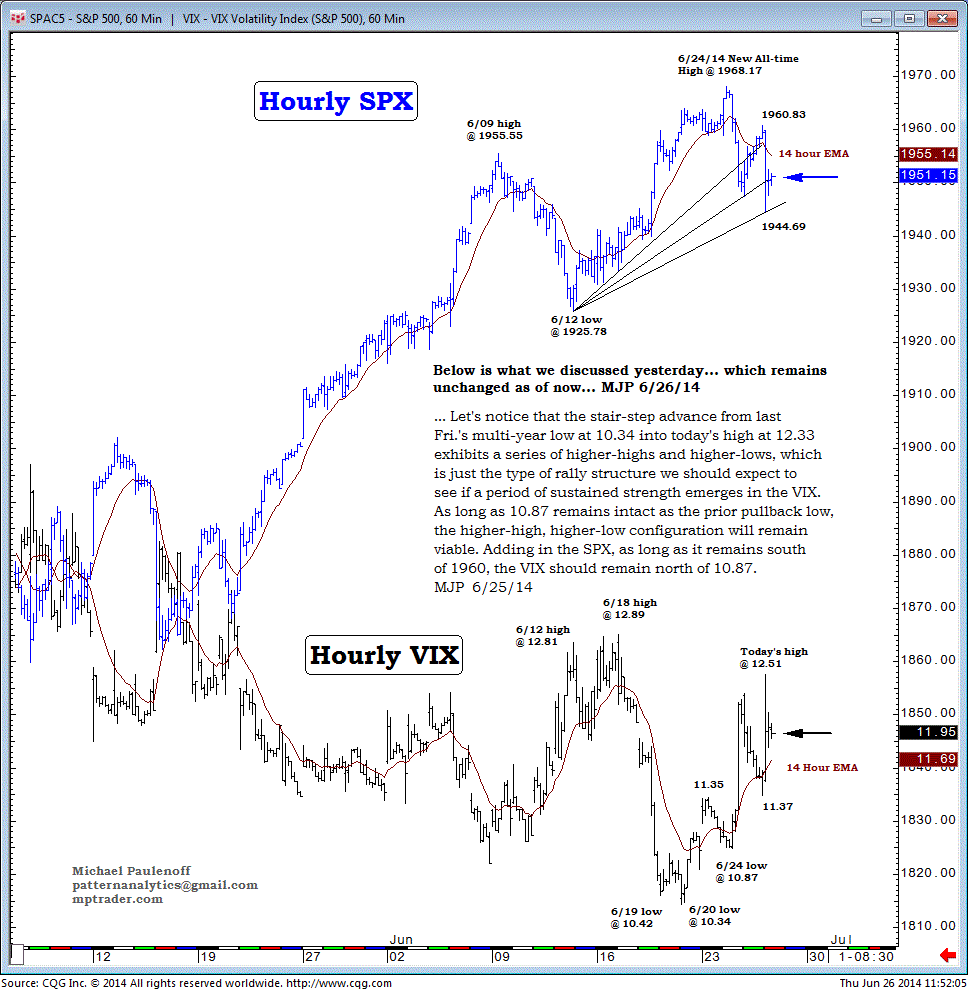
A Look at the Near-Term Pattern Relationship: Hourly SPX vs. VIX
Below is what we discussed yesterday, which remains unchanged as of now.
Let's notice that the stair-step advance from last Friday's multi-year low at 10.34 into today's high at 12.33 exhibits a series of higher-highs and higher-lows, which is just the type of rally structure we should expect to see if a period of sustained strength emerges in the VIX.
As long as 10.87 remains intact as the prior pullback low, the higher-high, higher-low configuration will remain viable.
Adding in the SPX, as long as it remains south of 1960, the VIX should remain north of 10.87.

