AAPL Breaks Out and Outperforms the SPY
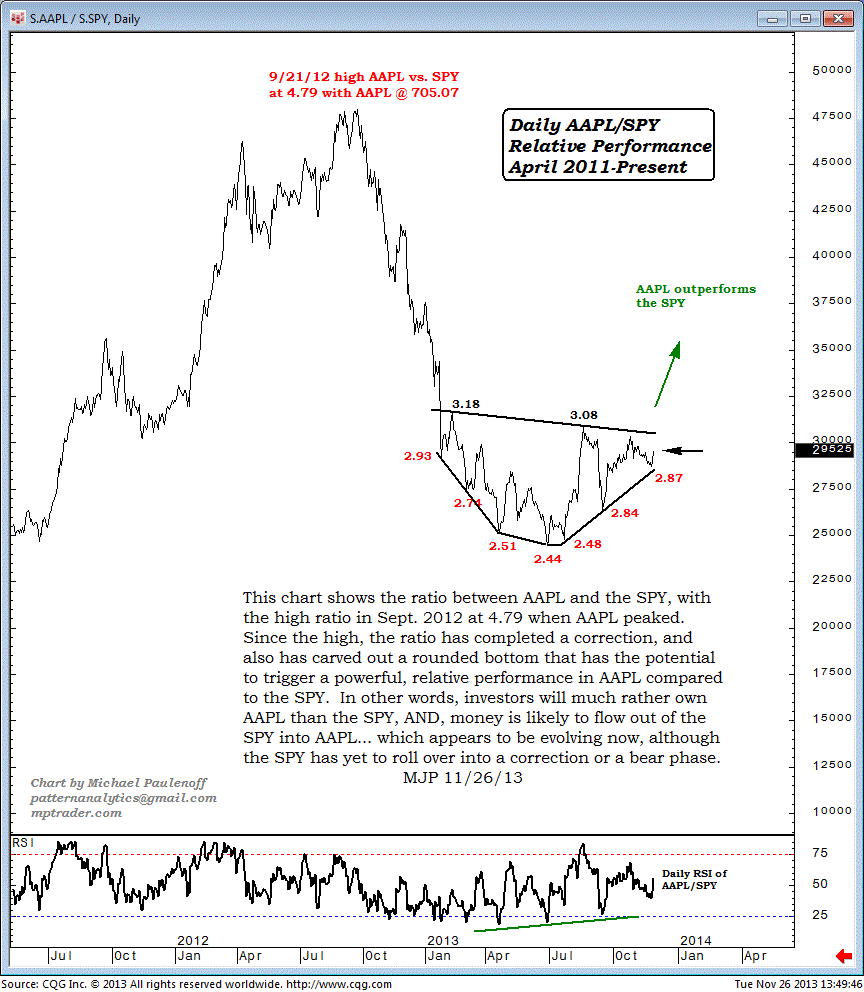
This chart shows the ratio between Apple Inc. (AAPL) and the SPDR S&P 500 (SPY), with the high ratio in Sept 2012 at 4.79 when AAPL peaked.
Since the high, the ratio has completed a correction, and also has carved out a rounded bottom that has the potential to trigger a powerful, relative performance in AAPL compared to the SPY.
In other words, investors will much rather own AAPL than the SPY, and money is likely to flow out of the SPY into AAPL, which appears to be evolving now, although the SPY has yet to roll over into a correction or a bear phase.

