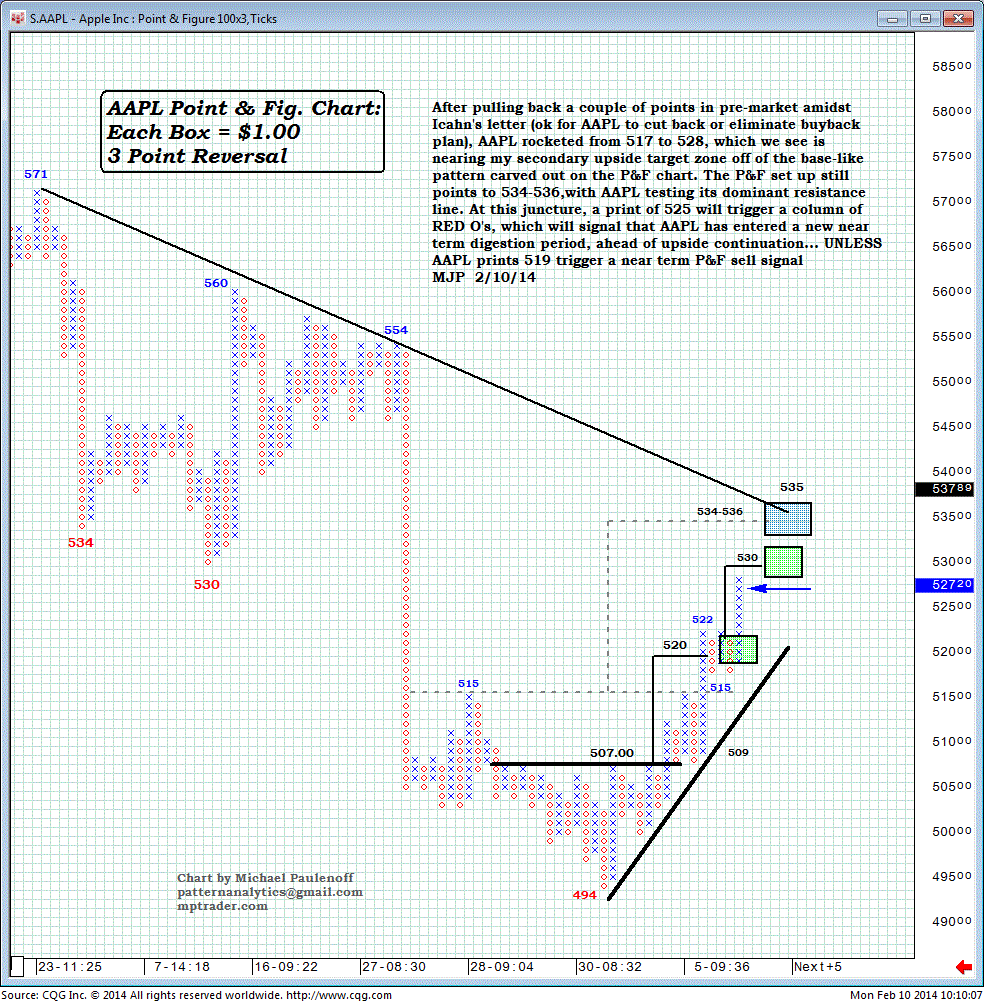
AAPL Point & Figure Chart Shows the Path Higher
After pulling back a couple of points in pre-market amidst Icahn's letter, which indicates it’s ok for Apple Inc. (AAPL) to cut back or eliminate buyback plan, AAPL rocketed from 517 to 528.
We see this as nearing my secondary, upside target zone off of the base-like pattern carved out on the P&F chart.
The P&F set-up still points to 534-536, with AAPL testing its dominant resistance line.
At this juncture, a print of 525 will trigger a column of red O's, which will signal that AAPL has entered a new near-term digestion period, ahead of upside continuation, unless AAPL prints 519 trigger a near-term P&F sell signal.

