After the First Day of Yellen Testimony, Has Anything Changed for the S&P (ES)?
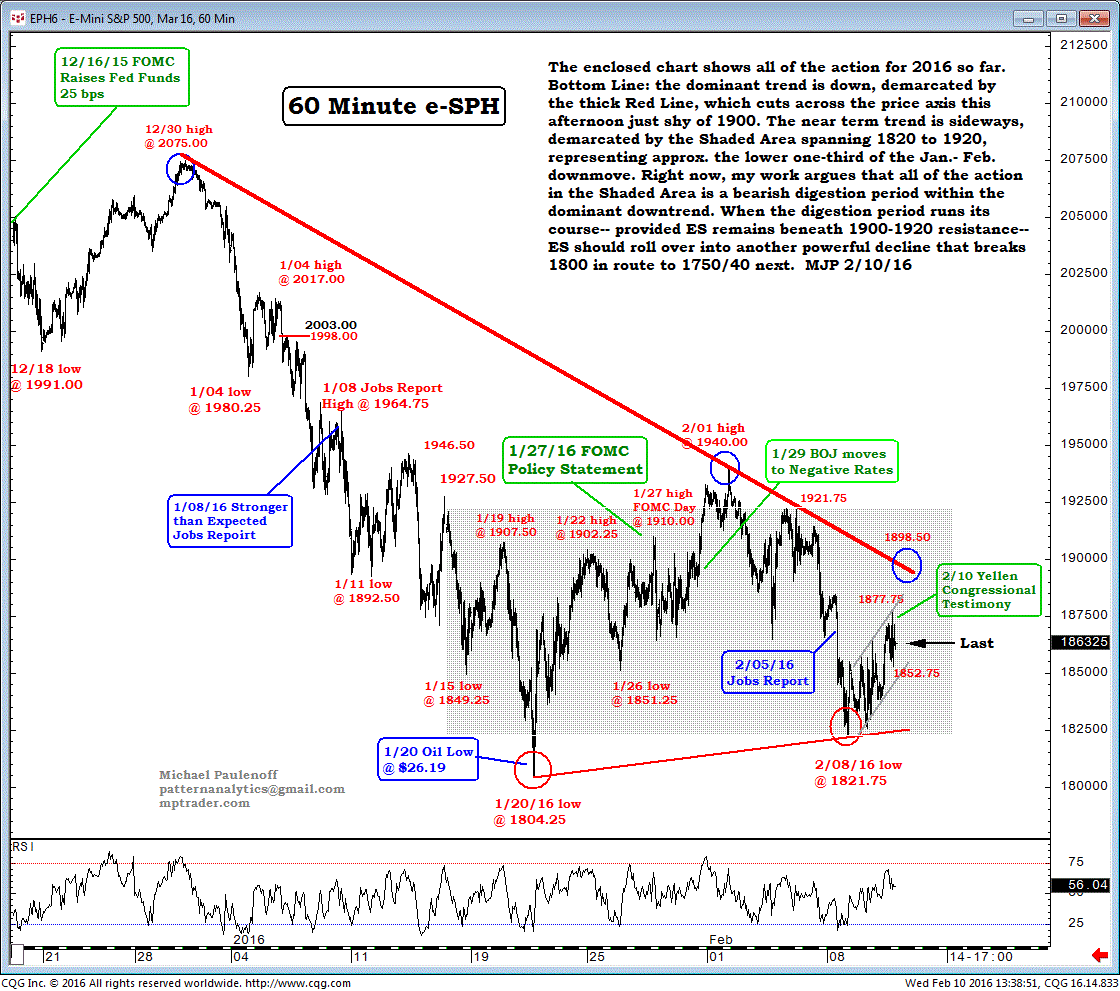
The enclosed chart shows all of the action for 2016 so far. Bottom Line: the dominant trend is down, demarcated by the thick Red Line, which cuts across the price axis this afternoon just shy of 1900.
The near-term trend is sideways, demarcated by the Shaded Area spanning 1820 to 1920, representing approximately the lower one-third of the Jan- Feb down move.
Right now, my work argues that all of the action in the Shaded Area is a bearish digestion period within the dominant downtrend.
When the digestion period runs its course-- provided ES (Emini S&P 500) remains beneath 1900-1920 resistance-- ES should roll over into another powerful decline that breaks 1800 in route to 1750/40 next.

