All Eyes on Cash SPX 1950
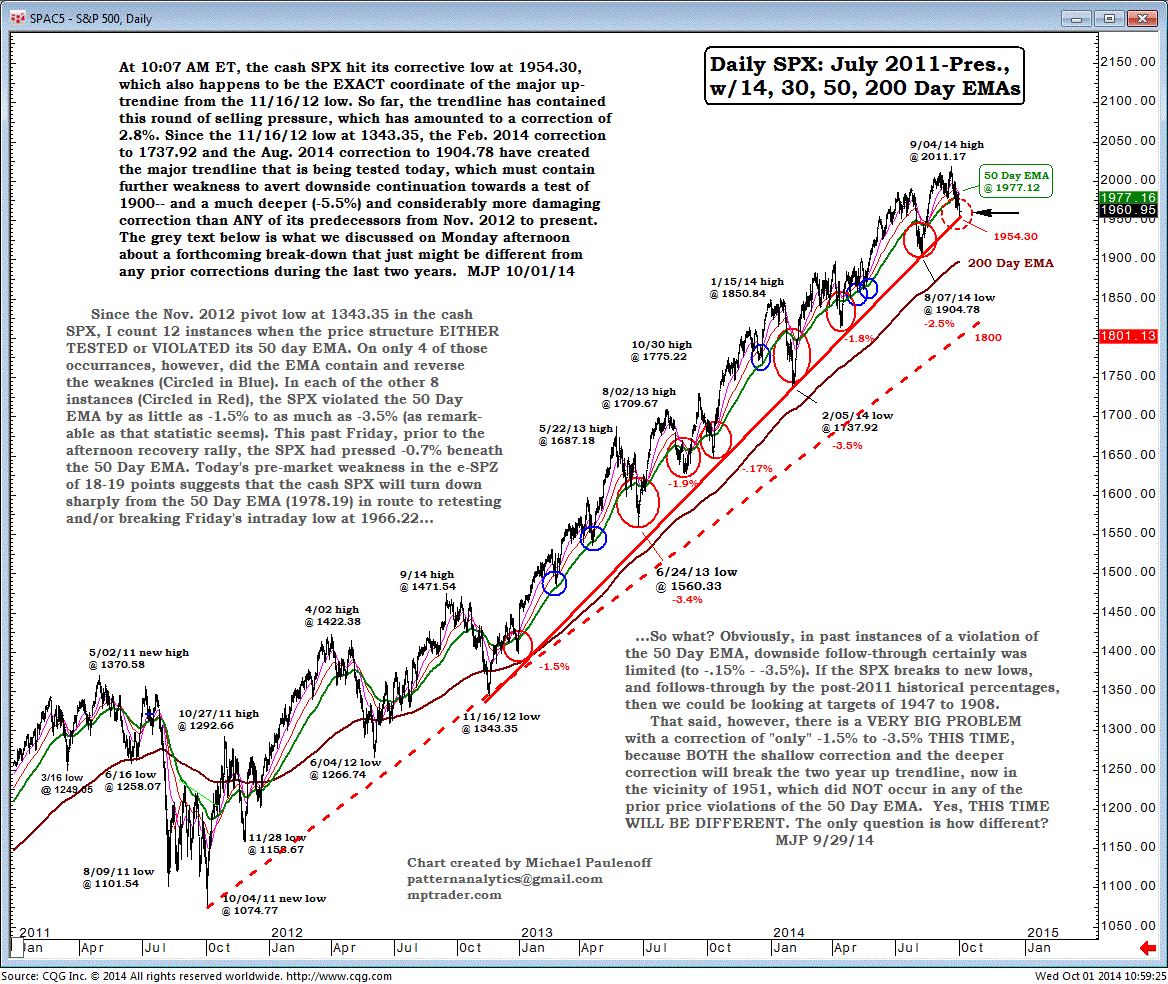
At 10:07 AM ET, the cash SPX hit its corrective low at 1954.30, which also happens to be the exact coordinate of the major up-trendline from the Nov 16, 2012 low.
So far, the trendline has contained this round of selling pressure, which has amounted to a correction of 2.8%.
Since the Nov 16, 2012, low at 1343.35, the Feb 2014 correction to 1737.92, and the Aug 2014 correction to 1904.78, have created the major trendline that is being tested today, which must contain further weakness to avert downside continuation towards a test of 1900-- and a much deeper (-5.5%) and considerably more damaging correction than ANY of its predecessors from Nov. 2012 to present.
The grey text below is what we discussed on Monday afternoon about a forthcoming break-down that just might be different from any prior corrections during the last two years. MJP 10/01/14
Since the Nov. 2012 pivot low at 1343.35 in the cash SPX, I count 12 instances when the price structure either tested or violated its 50-day EMA.
On only 4 of those occurrences, however, did the EMA contain and reverse the weakness (Circled in Blue). In each of the other 8 instances (Circled in Red), the SPX violated the 50-Day EMA by as little as -1.5% to as much as -3.5% (as remark- able as that statistic seems).
This past Friday, prior to the afternoon recovery rally, the SPX had pressed -0.7% beneath the 50-Day EMA.
Today's pre-market weakness in the e-SPZ of 18-19 points suggests that the cash SPX will turn down sharply from the 50-Day EMA (1978.19) in route to retesting and/or breaking Friday's intraday low at 1966.22.
So what?
Obviously, in past instances of a violation of the 50-Day EMA, downside follow-through certainly was limited (to -.15% - -3.5%).
If the SPX breaks to new lows, and follows-through by the post-2011 historical percentages, then we could be looking at targets of 1947 to 1908.
That said, however, there is a very big problem with a correction of "only" -1.5% to -3.5% this time, because both the shallow correction and the deeper correction will break the two-year up trendline, now in the vicinity of 1951, which did not occur in any of the prior price violations of the 50-Day EMA.
Yes, this time will be different. The only question is how different? MJP 9/29/14