As GOLD Falls to a New, 6-Year Low, The Dollar Climbs to a New, 12-Year High
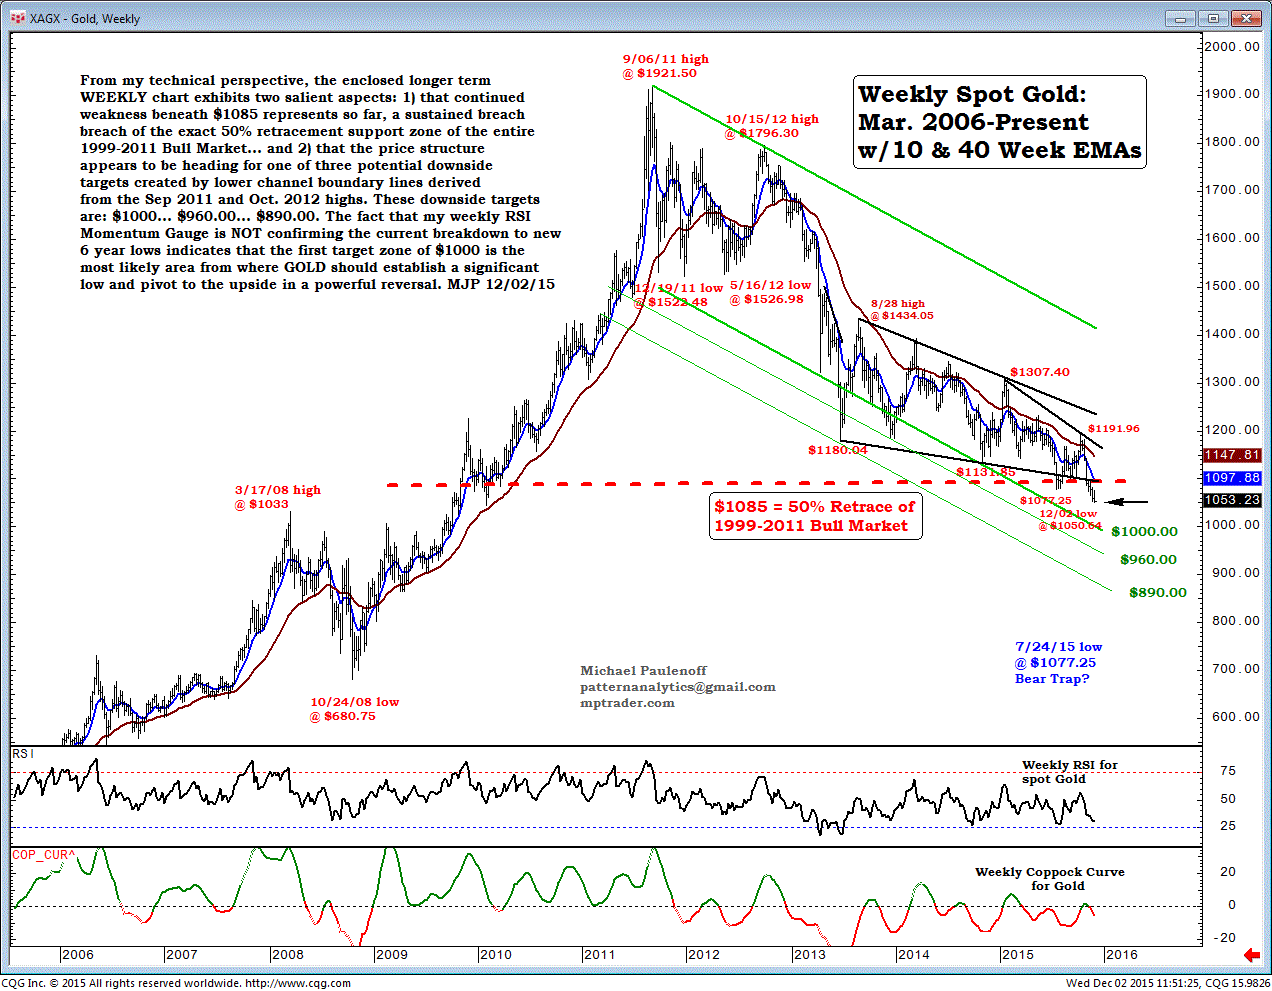
From my technical perspective, the enclosed longer-term weekly chart exhibits two salient aspects:
1) that continued weakness beneath $1085 represents, so far, a sustained breach breach of the exact 50% retracement support zone of the entire 1999-2011 Bull Market... and
2) that the price structure appears to be heading for one of three potential downside targets created by lower-channel boundary lines derived from the Sep 2011 and Oct 2012 highs.
These downside targets are: $1000... $960.00... $890.00.
The fact that my weekly RSI Momentum Gauge is not confirming the current breakdown to new, 6-year lows indicates that the first target zone of $1000 is the most likely area from where GOLD should establish a significant low and pivot to the upside in a powerful reversal.

