Awaiting Oil's Test of Support
By Mike Paulenoff, www.MPTrader.com
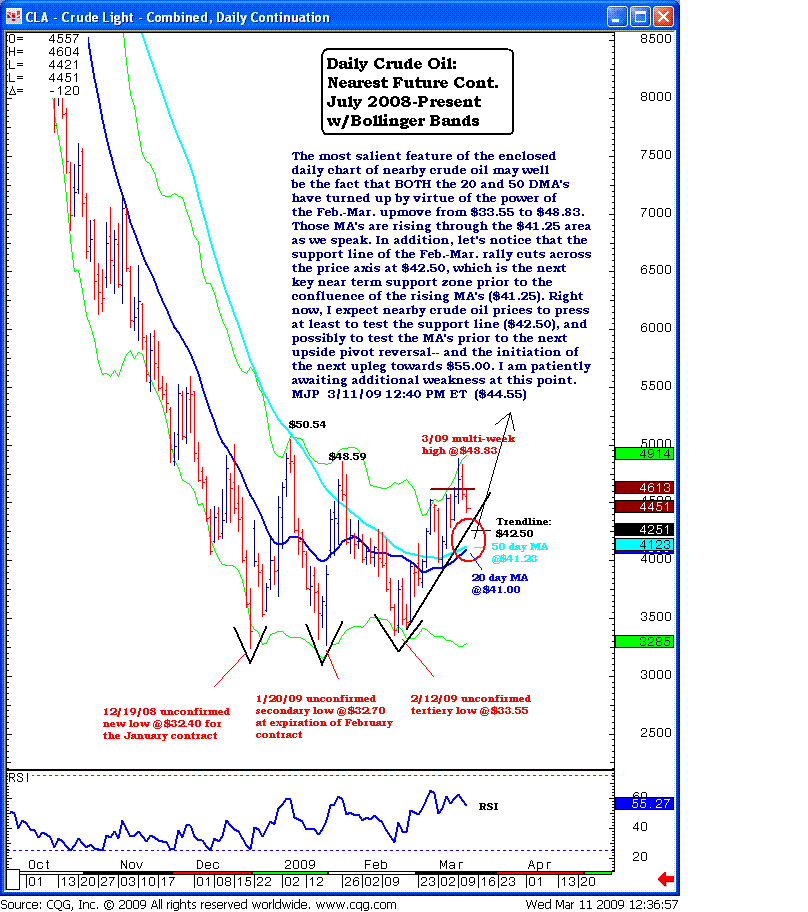
The most salient feature of the enclosed daily chart of nearby oil may well be the fact that BOTH the 20 and 50 day moving averages have turned up by virtue of the power of the Feb-Mar upmove from $33.55 to $48.83. Those moving averages are rising through the $41.25 area as we speak. In addition, let's notice that the support line of the Feb-Mar rally cuts across the price axis at $42.50, which is the next key near-term support zone prior to the confluence of the rising moving averages ($41.25). Right now I expect nearby crude oil prices to press at least to test the support line ($42.50) and possibly to test the moving averages prior to the next upside pivot reversal -- and the initiation of the next upleg towards $55.00. We am patiently awaiting additional weakness at this point as we consider playing crude oil via its U.S. Oil Fund ETF (NYSE: USO).

