Bearish Technicals for NDX, QQQQ
By Mike Paulenoff, www.MPTrader.com
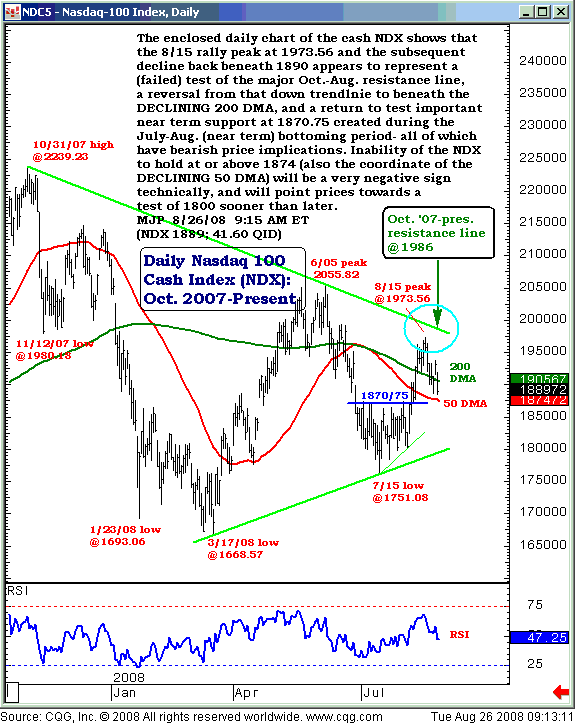
The enclosed daily chart of the cash NDX shows that the 8/15 rally peak at 1973.56 and the subsequent decline back beneath 1890 appears to represent a (failed) test of the major Oct-Aug resistance line, a reversal from that down trendline to beneath the declining 200 DMA, and a return to test important near-term support at 1870.75 created during the Jul-Aug (near-term) bottoming period. All of this has bearish price implications for the NDX and holders of the Q's ETF (Nasdaq: QQQQ). Inability of the NDX to hold at or above 1874 (also the coordinate of the declining 50 DMA) will be a very negative sign technically and will point prices towards a test of 1800 sooner or later.

