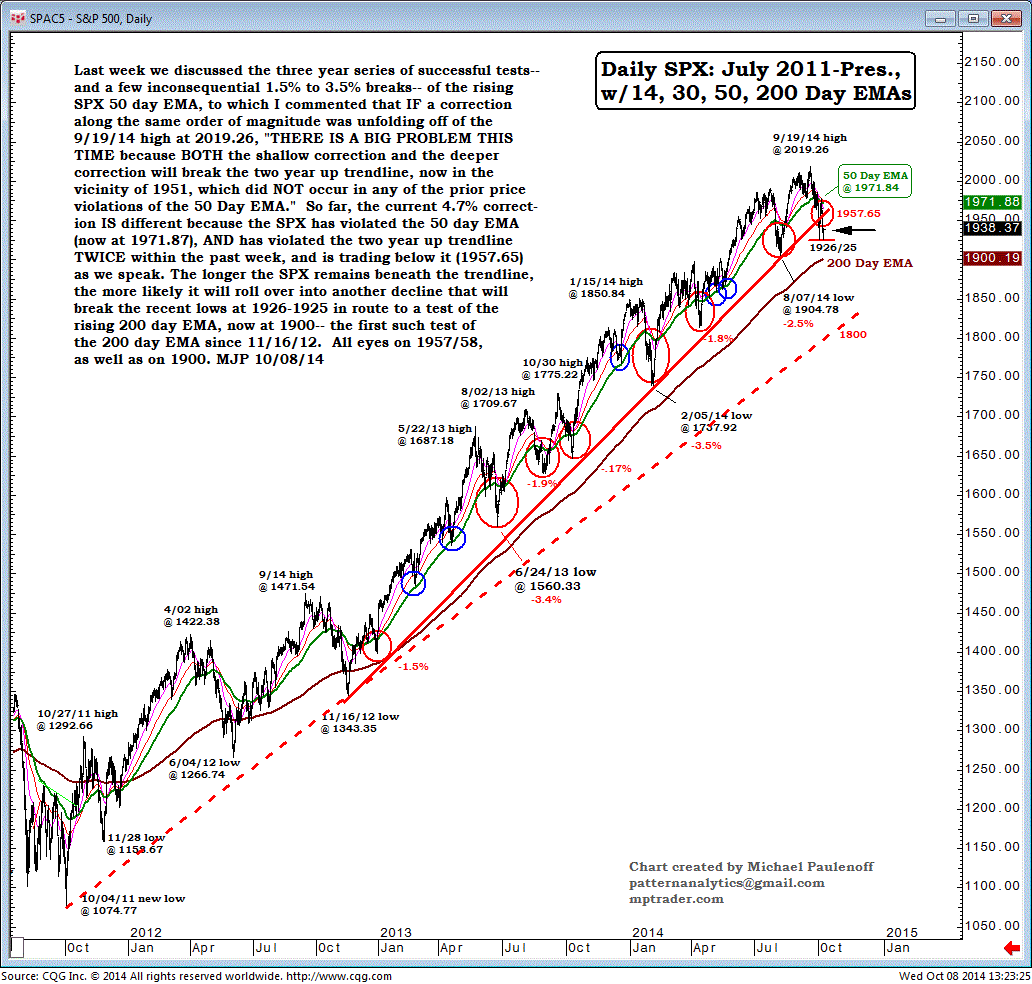
Big-Picture Chart on SPX Provides Key Directional Roadmap
Last week we discussed the three-year series of successful tests--and a few inconsequential 1.5% to 3.5% breaks-- of the rising SPX 50-day EMA.
I commented that if a correction along the same order of magnitude was unfolding off of the Sept 19 high at 2019.26, "THERE IS A BIG PROBLEM THIS TIME because BOTH the shallow correction, and the deeper correction, will break the two-year up trendline, now in the vicinity of 1951, which did NOT occur in any of the prior price violations of the 50-Day EMA."
So far, the current 4.7% correction is different because the SPX has violated the 50-day EMA (now at 1971.87), and has violated the two-year up trendline twice within the past week, and is trading below it (1957.65) as we speak.
The longer the SPX remains beneath the trendline, the more likely it will roll over into another decline that will break the recent lows at 1926-1925 in route to a test of the rising 200-day EMA, now at 1900-- the first such test of the 200-day EMA since Nov 16, 2012.
All eyes on 1957/58, as well as on 1900.

