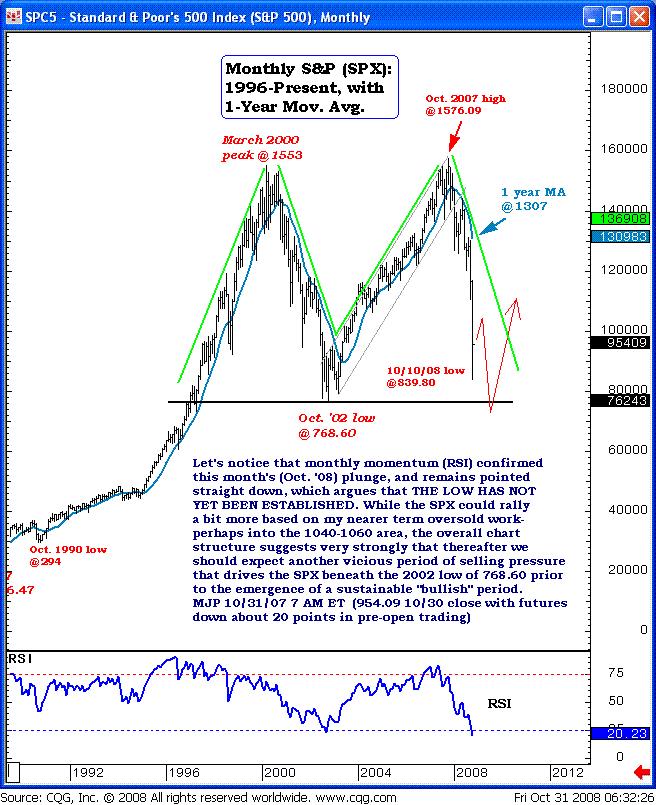
Big Picture S&P 500 View Points to More Selling After Near-term Rally
By Mike Paulenoff, www.MPTrader.com
Reviewing the big-picture, monthly S&P 500 chart, let's notice that the monthly momentum (RSI) confirmed this month's (Oct '08) plunge and remains pointed straight down, which argues that the low has not yet been established. While the SPX -- and its corresponding ETF, the S&P 500 Depository Receipts (AMEX: SPY) -- could rally a bit more based on my nearer-term oversold work, perhaps into the 1040-1060 area, the overall chart structure suggests very strongly that thereafter we should expect another vicious period of selling pressure that drives the SPX beneath the 2002 low at 768.60 prior to the emergence of a sustainable "bullish" period.

