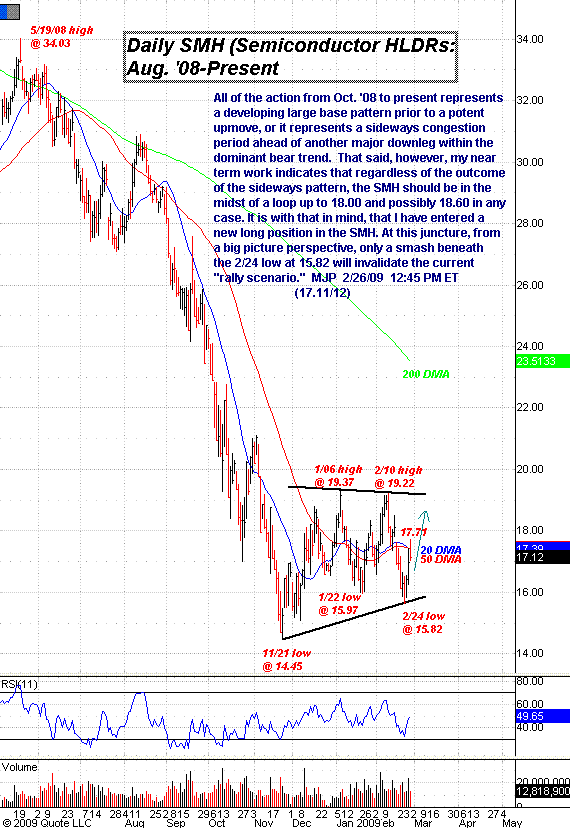
Bullish Pattern for Semiconductors
By Mike Paulenoff, www.MPTrader.com
All of the action from October 2009 to the present represents a developing large base pattern prior to a potent upmove, or it represents a sideways congestion period ahead of another major downleg within the dominant bear trend. That said, however, my near-term work indicates that regardless of the outcome of the sideways pattern, the Semiconductor HLDRs ETF (NYSE: SMH) should be in the midst of a loop up to 18.00 and possibly 18.60 in any case. At this juncture, from a big picture perspective, only a smash beneath the 2/24 low at 15.82 will invalidate the current rally scenario.

