Chicken or Egg: SPY vs TLT?
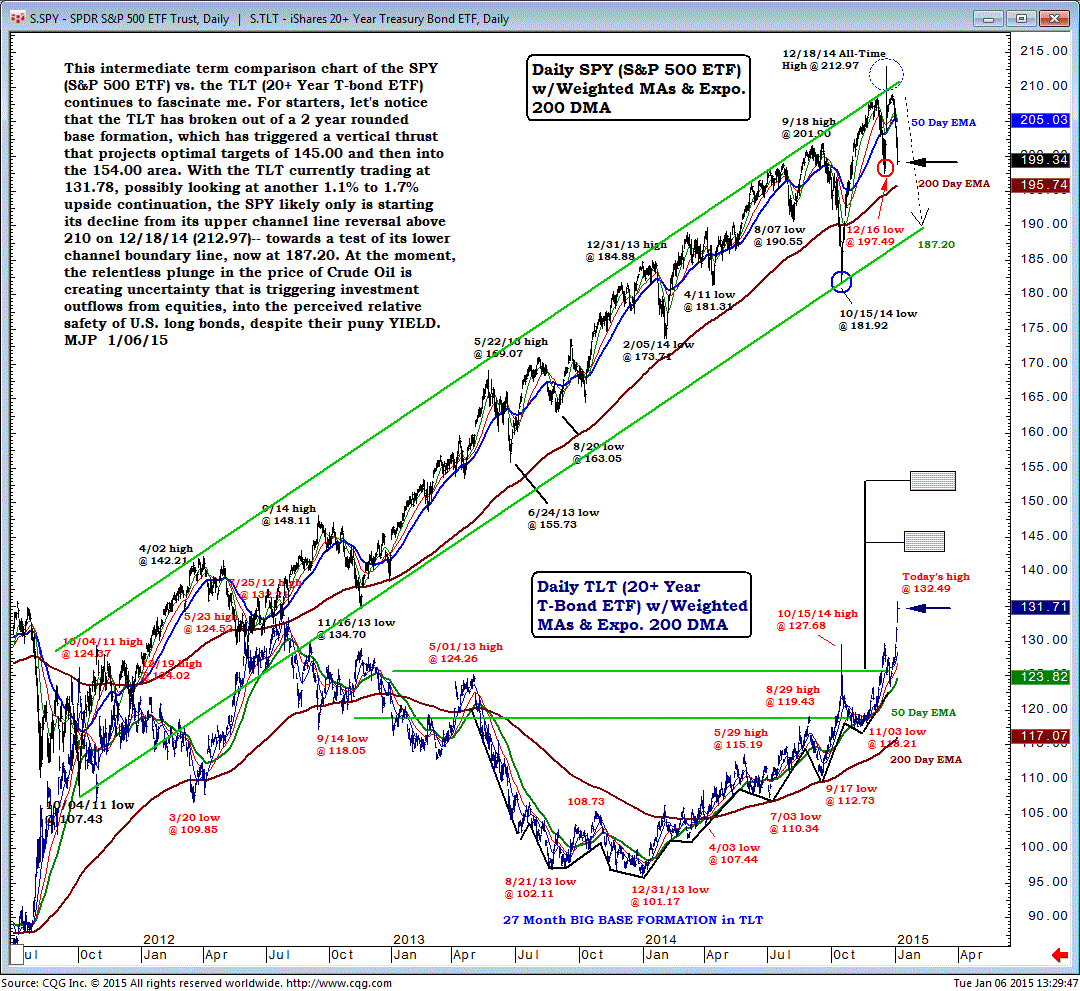
This intermediate-term comparison chart of the SPY (S&P 500 ETF) vs. the TLT (20+ Year T-bond ETF) continues to fascinate me.
For starters, let's notice that the TLT has broken out of a 2-year rounded-base formation, which has triggered a vertical thrust that projects optimal targets of 145.00 and then into the 154.00 area.
With the TLT currently trading at 131.78, possibly looking at another 1.1% to 1.7% upside continuation, the SPY likely only is starting its decline from its upper-channel line reversal above 210 on Dec 18 (212.97) towards a test of its lower-channel boundary line, now at 187.20.
At the moment, the relentless plunge in the price of Crude Oil is creating uncertainty that is triggering investment outflows from equities, into the perceived relative safety of U.S. long bonds, despite their puny Yield.

