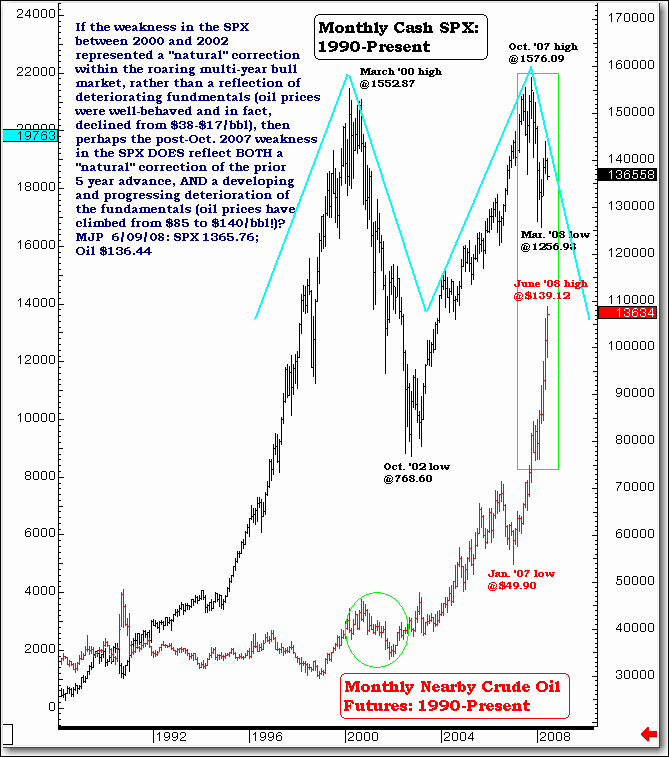
Comparing S&P to Crude Oil Illustrates Market Weakness
By Mike Paulenoff, www.MPTrader.com
Our big picture view of the S&P 500 compared (or contrasted) to the price action of crude oil concludes that we need to get long the UltraShort S&P 500 ProShares ETF (AMEX: SDS), or short the SPY, at some point in the hours directly ahead. If the weakness in the S&P 500 between 2000 and 2002 represented a "natural" correction within the roaring multi-year bull market, rather than a reflection of deteriorating fundamentals (oil prices were well-behaved and in fact declined from $38 to $17bbl), then perhaps the post-October 2007 weakness in the SPX does reflect both a "natural" correction of the prior 5-year advance and a developing and progressing deterioration of the fundamentals (oil prices have climbed from $85 to $140/bbl).

