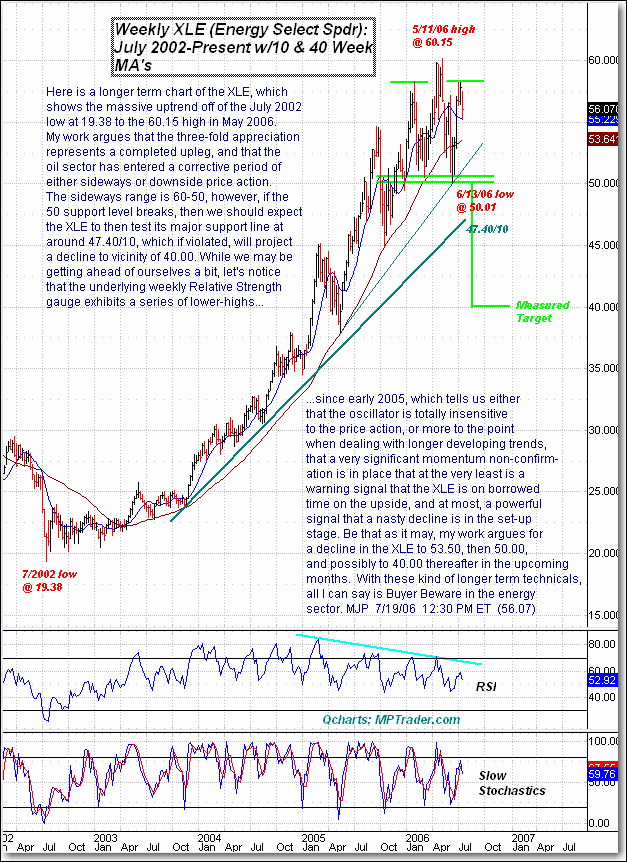
Corrective Period for Crude Oil (XLE)

See the longer-term chart of the XLE, which shows the massive uptrend off of the July 2002 low at 19.39 to the 60.15 high in May 2006. My work argues that the three-fold appreciation represents a completed upleg, and that the oil sector has entered a corrective period of either sideways or downside price action.

For more of Mike Paulenoff, sign up for a Free 15-Day Trial to his ETF Trading Diary.


  Matched
x
  • Action-Oriented Trade Set-Ups in Stocks & ETFs
  • Macro Analysis of the Broader Markets
  • Detailed Technical Guidance for each Trading Idea
  • Live Interaction w/ Mike & Our Member Community
  • And Much, Much More!
Join Now! - Special Offer!
Veteran Wall Street analyst and financial author, Mike provides detailed and timely analysis and trade set-ups on a range of markets. Read more...

Have Mike's “Out Front” morning analysis delivered FREE to your email inbox twice weekly!