Crude Oil and ES Track Strongly Higher, as Risk On Prevails...
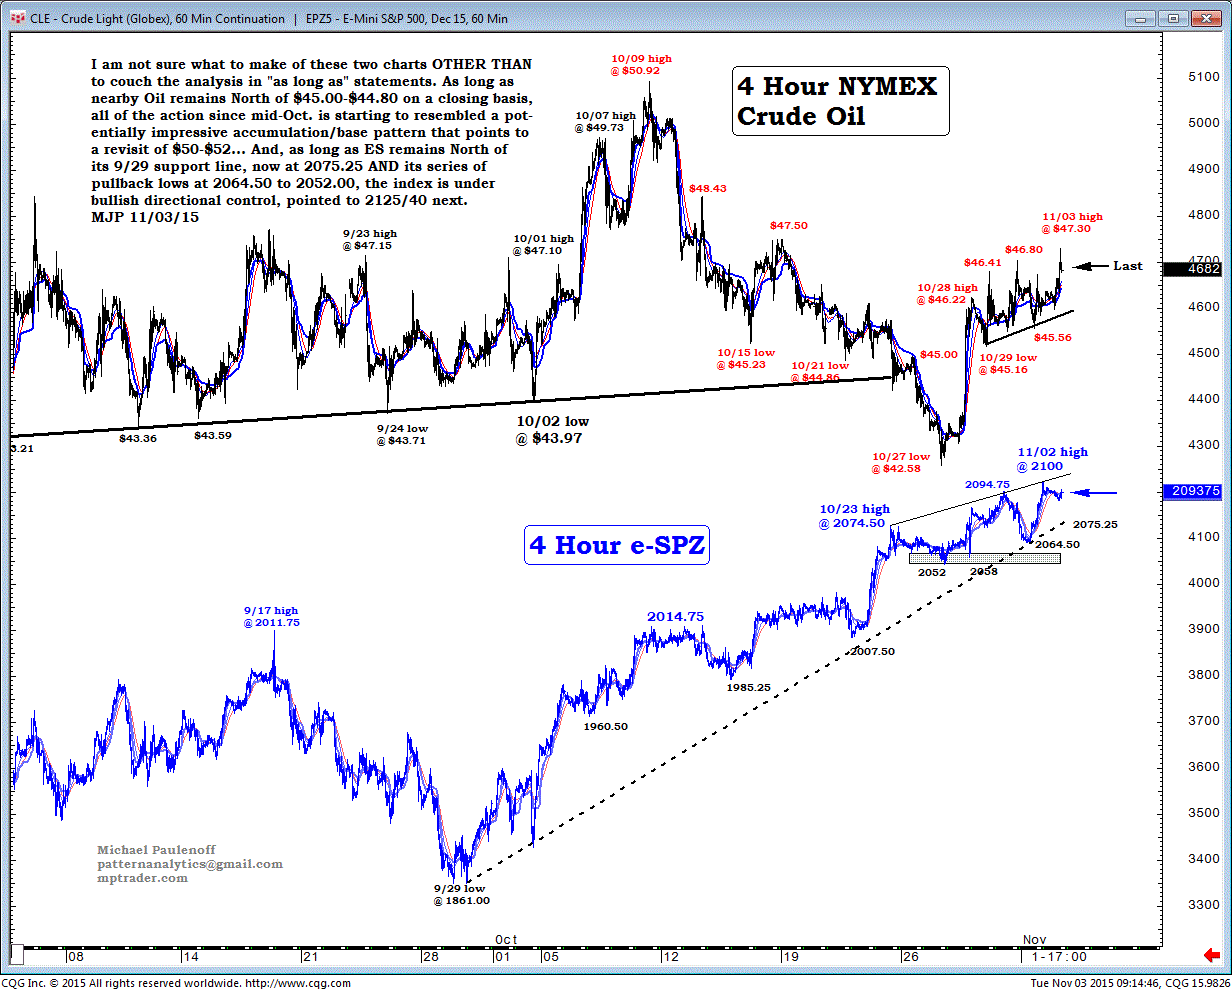
I am not sure what to make of these two charts other than to couch the analysis in "as long as" statements.
As long as nearby Oil remains north of $45.00-$44.80 on a closing basis, all of the action since mid-Oct is starting to resemble a potentially-impressive, accumulation/base pattern that points to a revisit of $50-$52, and as long as ES remains north of its Sept 29 support line, now at 2075.25, and its series of pullback lows at 2064.50 to 2052.00, the index is under bullish-directional control, pointed to 2125/40 next.

