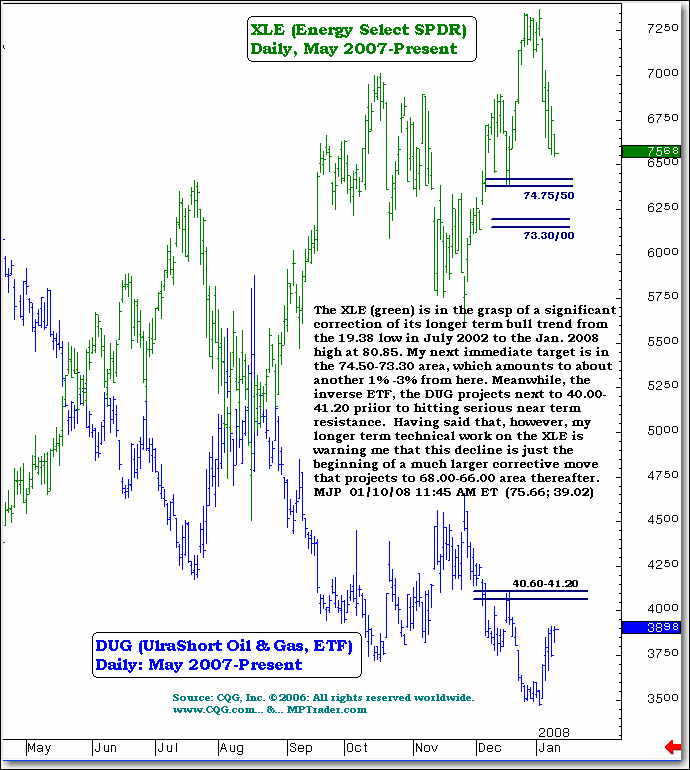
Decline in Energy, XLE Beginning of Much Larger Correction?
By Mike Paulenoff, www.MPTrader.com
Time for a look at a comparison chart between the Energy Select SPDR ETF (AMEX: XLE) and the Proshares UltraShort Oil & Gas ETF (AMEX: DUG). The XLE (green in our chart) is in the grasp of a significant correction of its longer-term bull trend from the 19.38 low in July 2002 to the January 2008 high at 80.85. My next immediate target is in the 74.50-73.30 area, which amounts to about another 1%-3% from here. Meanwhile, the inverse ETF, the DUG projects next to 40.00-41.20 prior to hitting serious near-term resistance. Having said that, however, my longer-term technical work on the XLE is warning me that this decline is just the beginning of a much larger corrective move that projects to 68.00-66.00 area thereafter.

