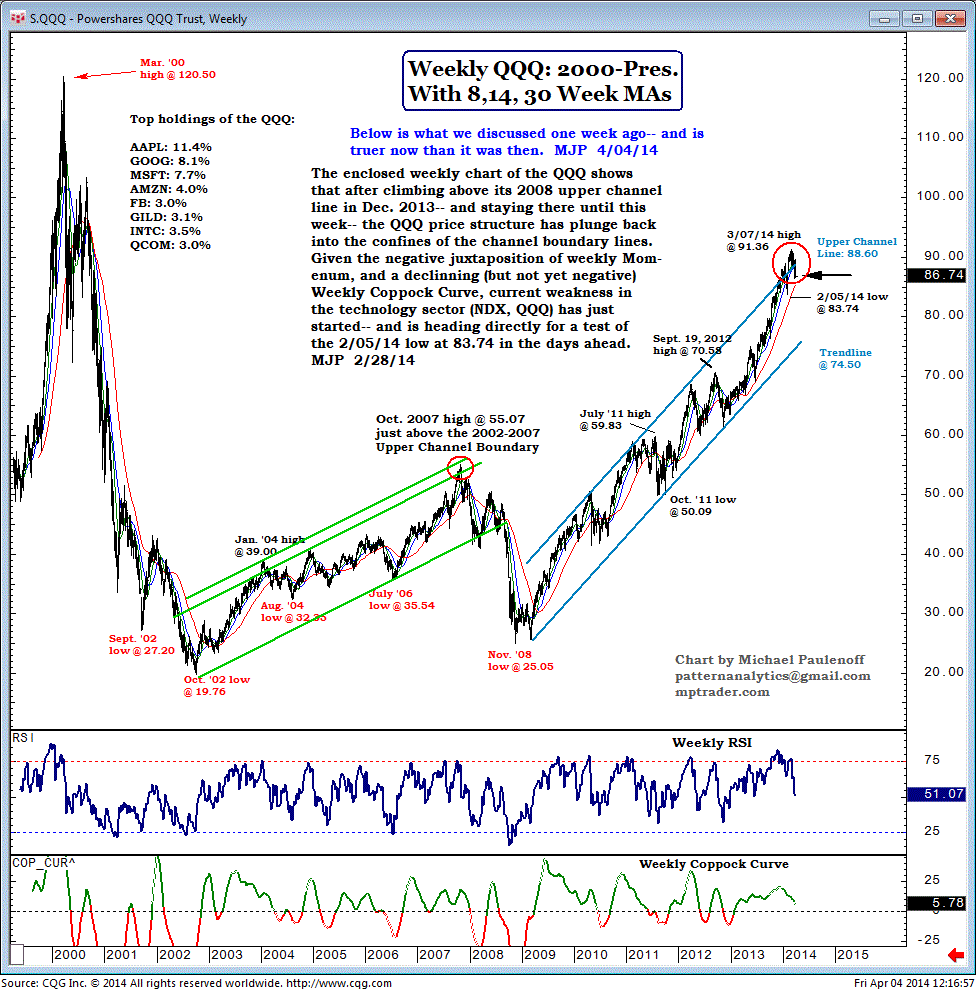
Deja vu With Oct 2007 for QQQ's?
Below is what we discussed one week ago-- and is truer now than it was then. MJP 4/04/14
The weekly chart shown below of the PowerShares QQQ (QQQ) shows that after climbing above its 2008 upper-channel line in Dec 2013, and staying there until this week, the QQQ price structure has plunged back into the confines of the channel boundary lines.
Given the negative juxtaposition of weekly momentum, and a declining, but not yet negative, weekly Coppock Curve, current weakness in the technology sector, the NDX QQQ, has just started, and is heading directly for a test of the Feb 5 low at 83.74 in the days ahead.
MJP 2/28/14.

