Dollar Index (DXY) Nears Very Substantial Resistance
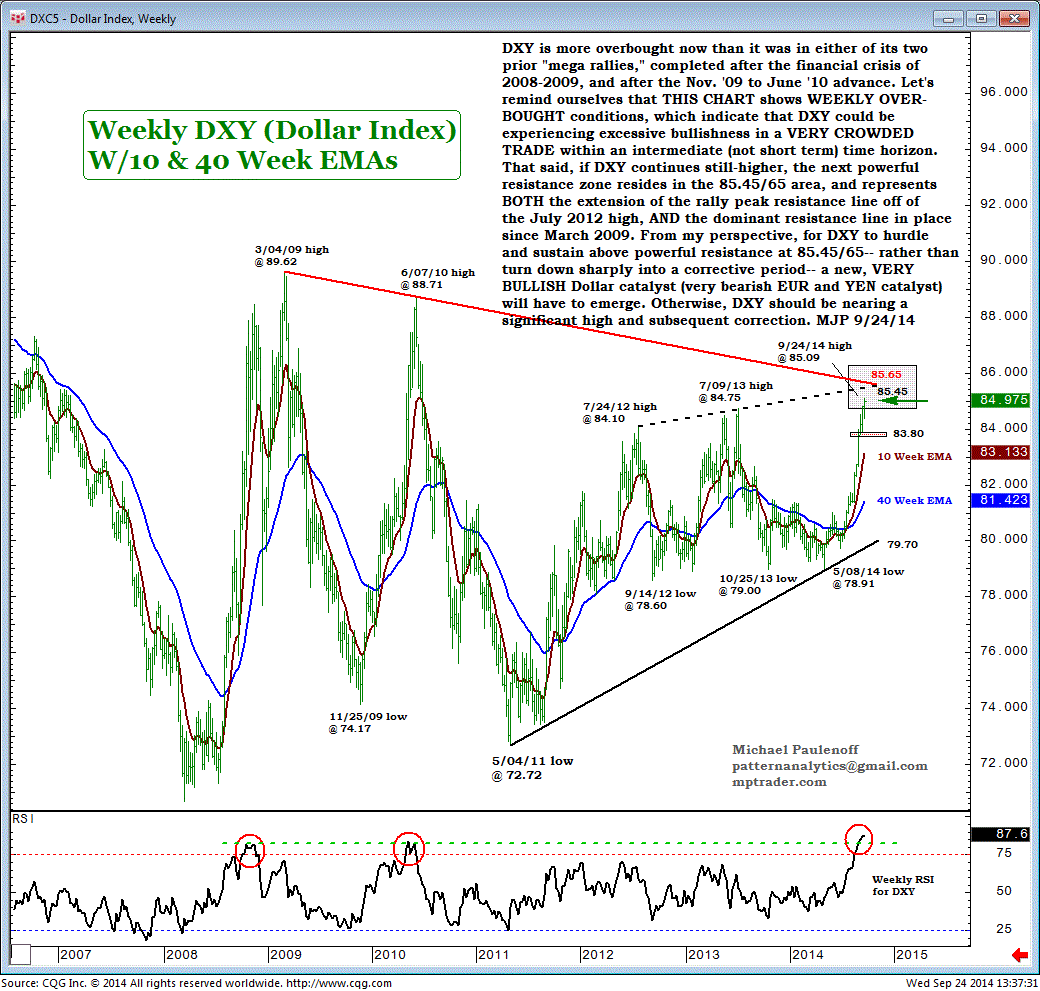
DXY is more overbought now than it was in either of its two prior "mega rallies," completed after the financial crisis of 2008-2009, and after the November 2009 to June 2010 advance.
Let's remind ourselves that this chart shows weekly overbought conditions, which indicate that DXY could be experiencing excessive bullishness in a very crowded trade within an intermediate (not short term) time horizon.
That said, if DXY continues still-higher, the next powerful resistance zone resides in the 85.45/65 area, and represents BOTH the extension of the rally peak resistance line off of the July 2012 high, AND the dominant resistance line in place since March 2009.
From my perspective, for DXY to hurdle and sustain above powerful resistance at 85.45/65-- rather than turn down sharply into a corrective period-- a new, VERY BULLISH Dollar catalyst (very bearish EUR and YEN catalyst) will have to emerge.
Otherwise, DXY should be nearing a significant high and subsequent correction.