ES Rallies in Lockstep with Oil
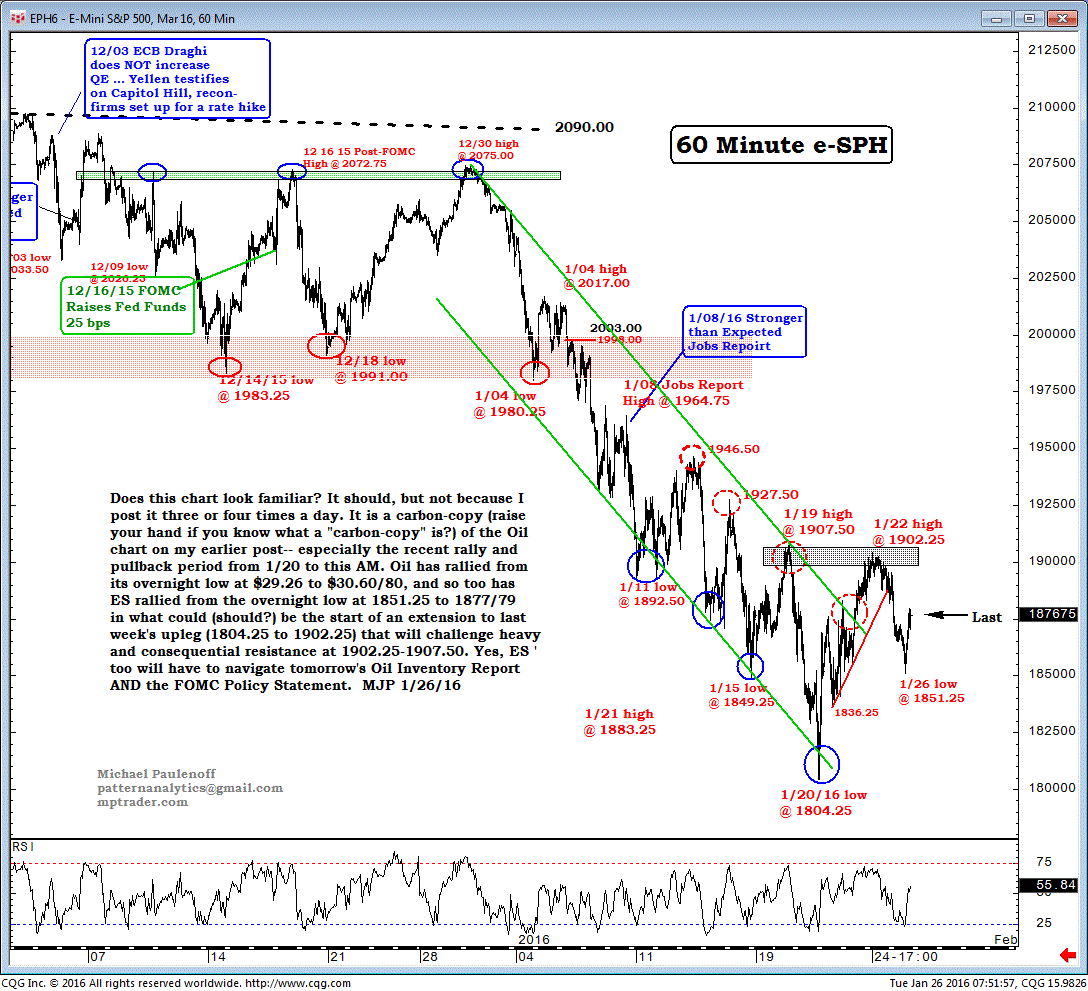
Does this chart look familiar? It should, but not because I post it three or four times a day. It is a carbon-copy (raise your hand if you know what a "carbon-copy" is?) of the Oil chart on my earlier post -- especially the recent rally and pullback period from Jan 20 to this AM.
Oil has rallied from its overnight low at $29.26 to $30.60/80, and so too has ES rallied from the overnight low at 1851.25 to 1877/79 in what could (should?) be the start of an extension to last week's upleg (1804.25 to 1902.25) that will challenge heavy and consequential resistance at 1902.25-1907.50.
Yes, ES, too, will have to navigate tomorrow's Oil Inventory Report AND the FOMC Policy Statement.