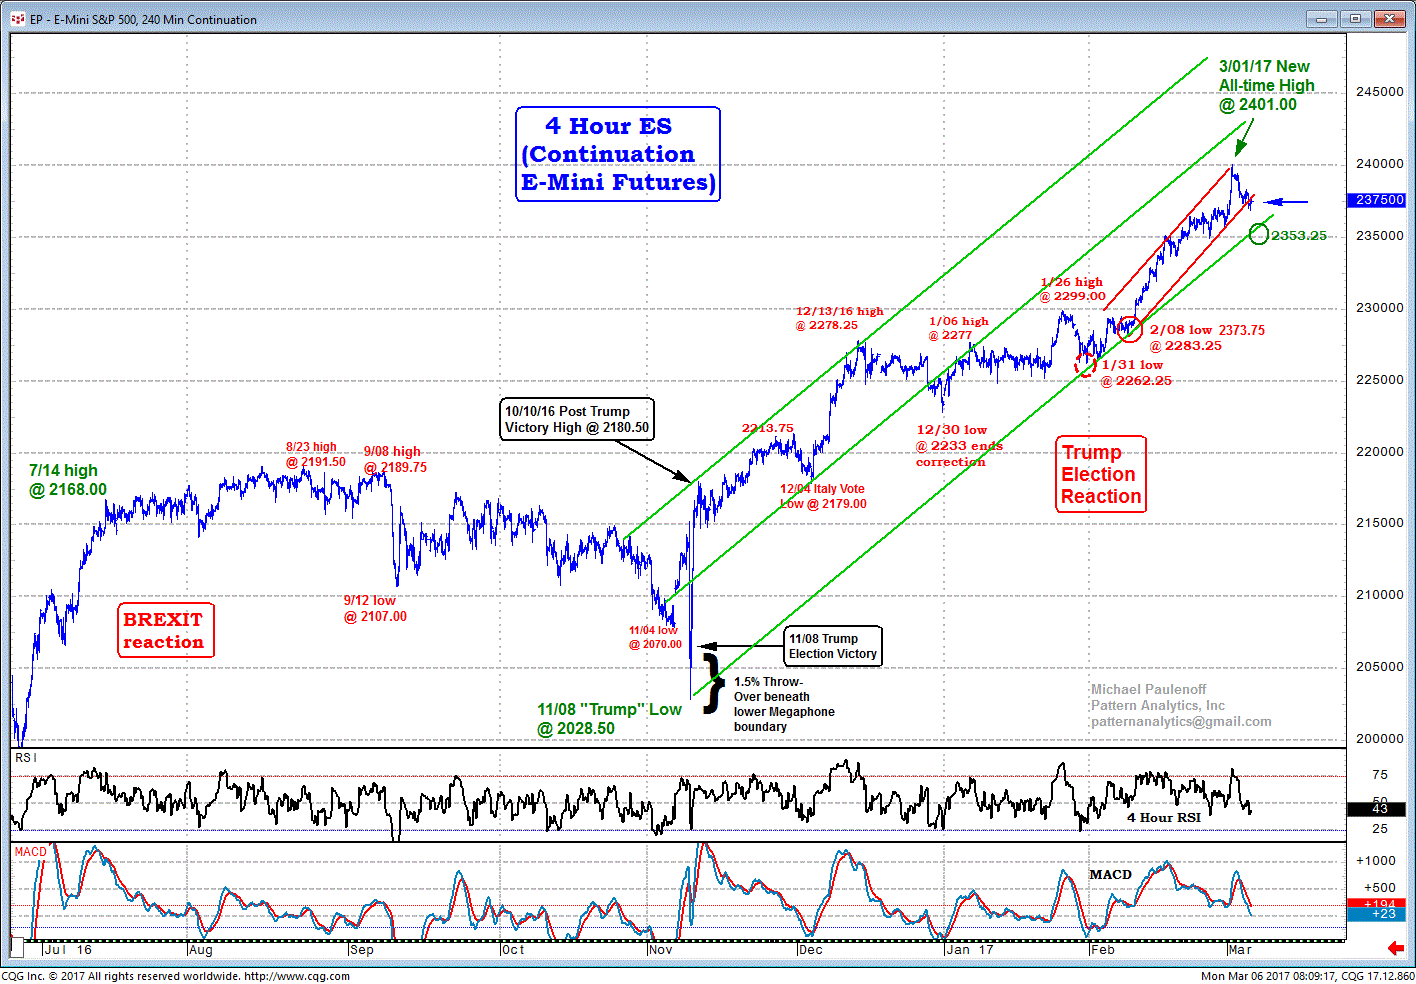
ES Rolls Over a Bit. Has a Measurable Correction Started?
ES (Emini S&P 500) is down about 6 points in pre-market action, and is trading below the nearest-term (red) support line (from Feb 8), now at 2377.25, which has not (yet?) triggered downside follow-through pressure towards a test of much more important trendline support, now at 2353.25.
As long as the 2353.00-2350.00 support zone remains intact, so, too, will the dominant uptrend.
However, if 2353/00 is violated and sustained, ES will become vulnerable to a deeper correction, into the 2300 target zone.... last is 2375.00.

