ES Whipsaws the Clinton Bulls, ES Plunges Beneath its 4-Week Support Line
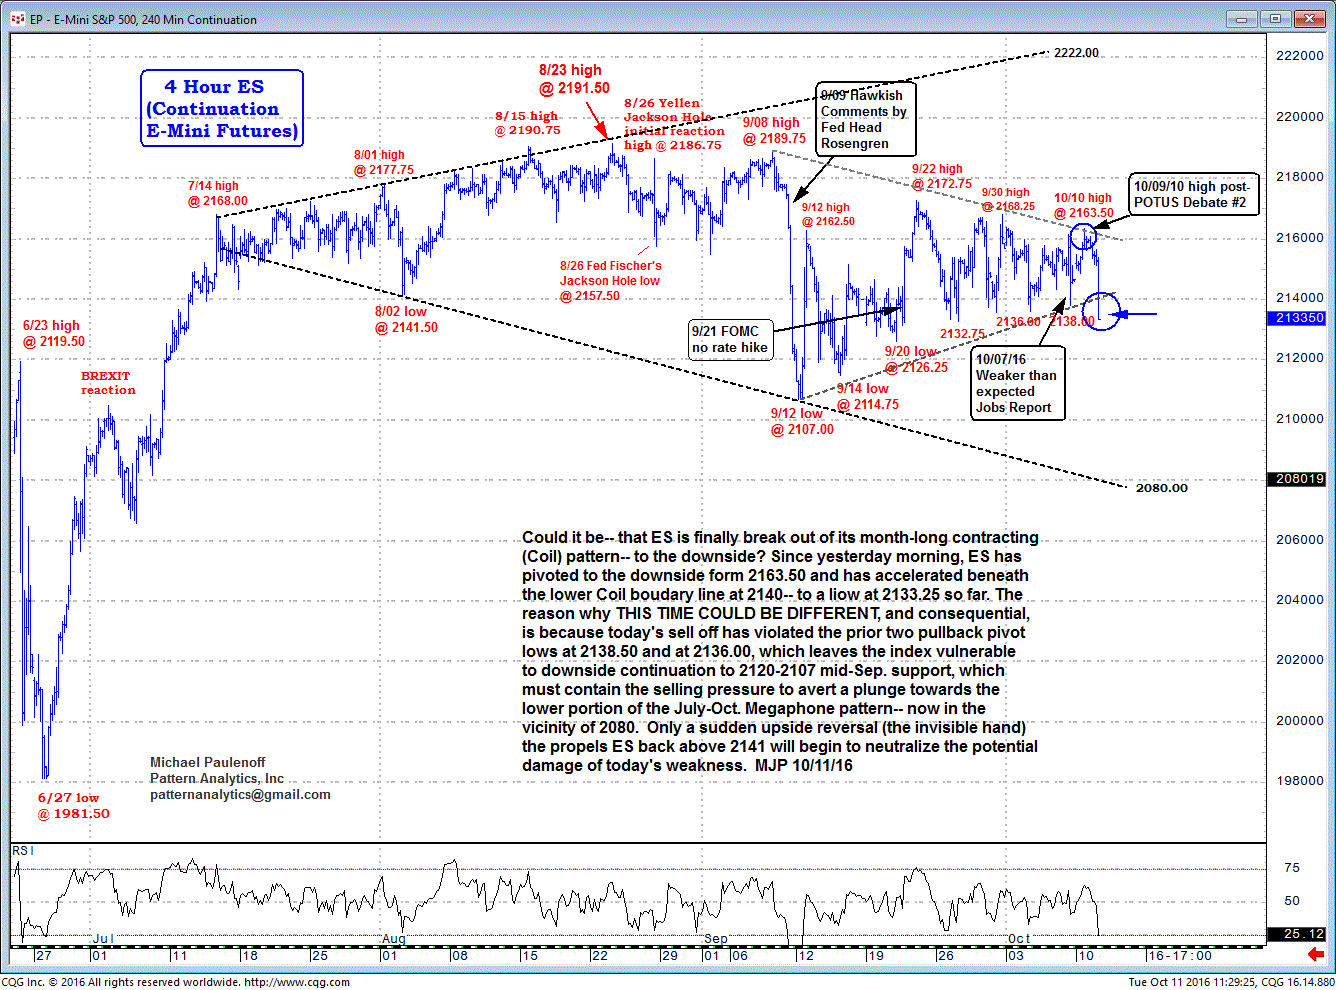
Could it be-- that ES (Emini S&P 500) is finally breaking out of its month-long contracting (Coil) pattern-- to the downside?
Since yesterday morning, ES has pivoted to the downside form 2163.50, and has accelerated beneath the lower-coil boundary line at 2140-- to a low at 2133.25 so far.
The reason why this time could be different, and consequential, is because today's sell off has violated the prior two, pullback pivot lows at 2138.50 and at 2136.00, which leaves the index vulnerable to downside continuation to 2120-2107 mid-Sept support, which must contain the selling pressure to avert a plunge towards the lower portion of the July-Oct megaphone pattern-- now in the vicinity of 2080.
Only a sudden upside reversal (the invisible hand) the propels ES back above 2141 will begin to neutralize the potential damage of today's weakness.

