FB Thrusts Towards a Test of its All-Time High
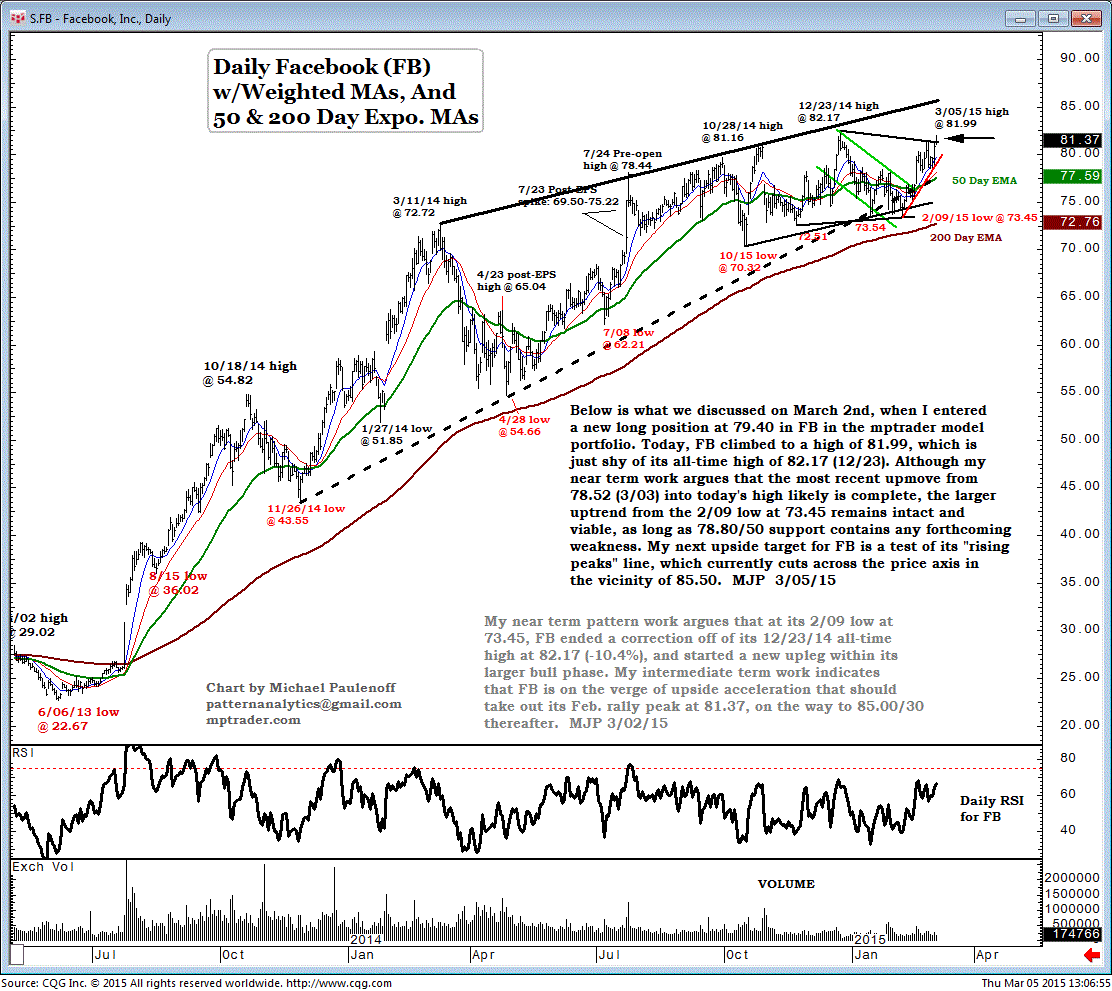
Below is what we discussed on March 2, when I entered a new long position at 79.40 in Facebook, Inc. (FB) in the mptrader model portfolio.
Today, FB climbed to a high of 81.99, which is just shy of its all-time high of 82.17 (Dec 23).
Although my near-term work argues that the most recent upmove from 78.52 (Mar 3) into today's high likely is complete, the larger uptrend from the Feb 9 low at 73.45 remains intact and viable, as long as 78.80/50 support contains any forthcoming weakness.
My next upside target for FB is a test of its "rising peaks" line, which currently cuts across the price axis in the vicinity of 85.50. MJP 3/05/15
My near-term pattern work argues that at its Feb 9 low at 73.45, FB ended a correction off of its Dec 23, 2014, all-time high at 82.17 (-10.4%), and started a new upleg within its larger bull phase.
My intermediate-term work indicates that FB is on the verge of upside acceleration that should take out its Feb rally-peak at 81.37, on the way to 85.00/30 thereafter. MJP 3/02/15

