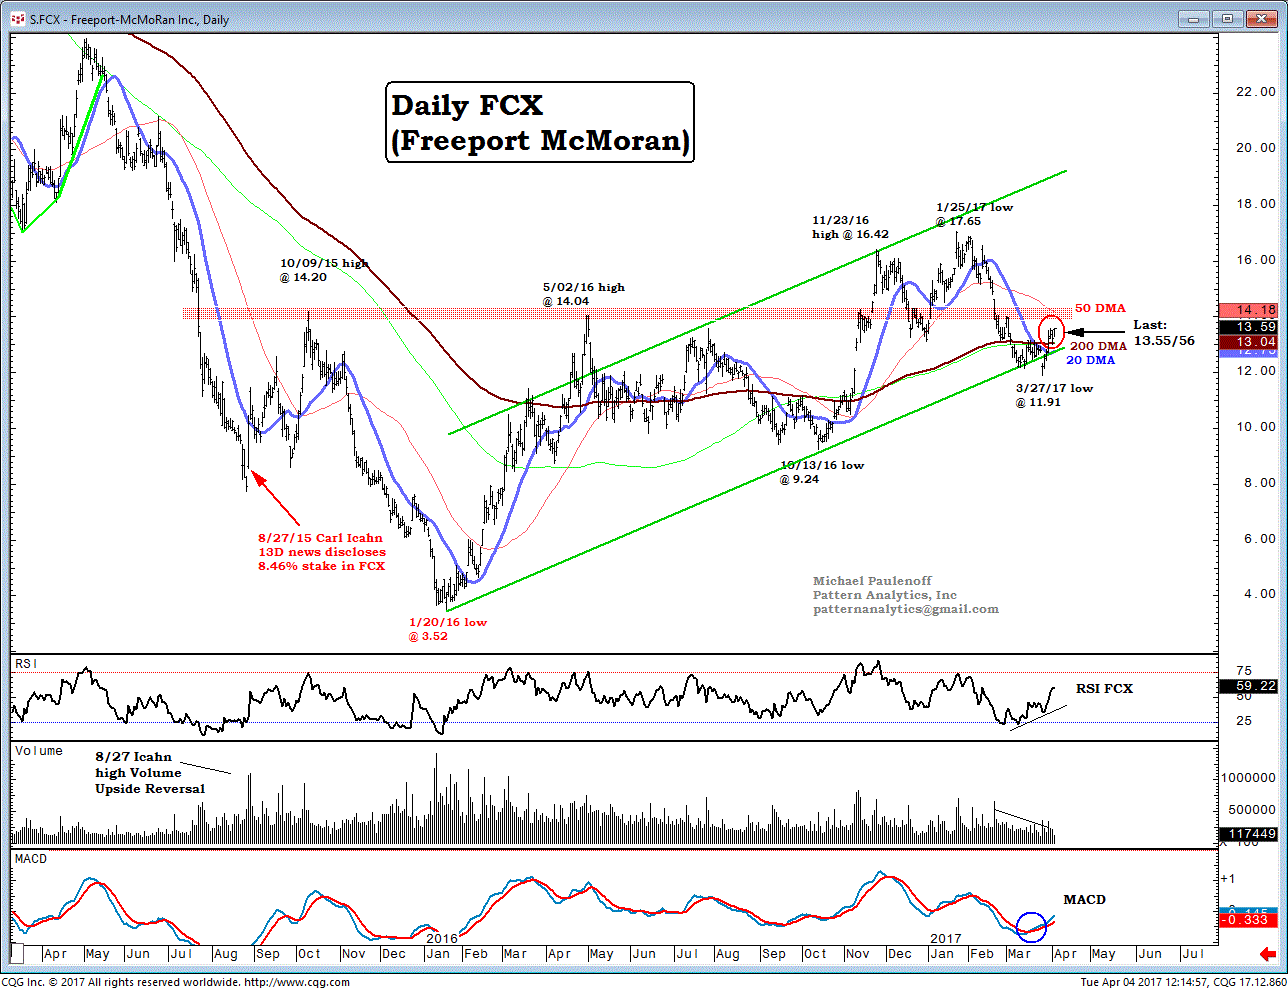
FCX Shows Some Impressive Technical Behavior off of its March Low
Freeport-McMoRan Inc. (FCX) certainly does have the right look of completing a major correction off of its "orthodox" price-momentum high at 16.42 last Nov 23, into the 11.91 Mar 27 low.
Since then, FCX has climb above its 20-DMA, and its 200-DMA, and is poised to confront key, consequential longer-term resistance at 13.80 - 14.20, which, if accomplished, will trigger upside potential to revisit its 1.40 - 17.65 high-zone.
Let's remind ourselves that all of the action off of the Jan, 2016, low at 3.52 exhibits a series of higher-highs and higher-pullback-lows, which, otherwise, should be considered a major uptrend that remains intact and dominant.
Time to enter FCX in our model portfolio with a medium-term time horizon... Last is 13.59/60

