Gold Has Broken Down; What Does It Mean?
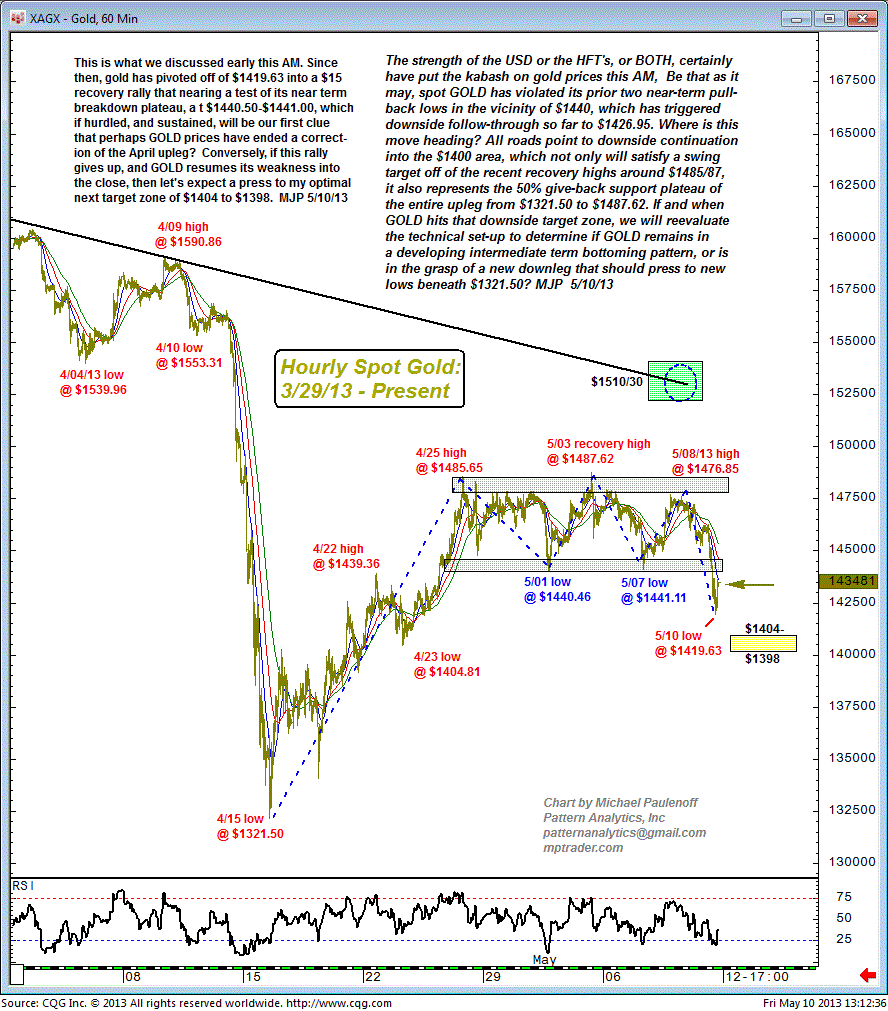
Below (in italics) is what we discussed early this morning. Since then, gold has pivoted off of $1419.63 into a $15 recovery rally that nearing a test of its near-term breakdown plateau, at $1440.50-$1441.00, which if hurdled, and sustained, will be our first clue that perhaps golf prices have ended a correction of the April upleg?
Conversely, if this rally gives up, and gold -- along with the SPDR Gold Shares (GLD) -- resumes its weakness into the close, then let's expect a press to my optimal next target zone of $1404 to $1398.
The strength of the USD or the HFT's, or both, certainly have put the kabash on gold prices this morning. Be that as it may, spot gold has violated its prior two near-term pull-back lows in the vicinity of $1440, which has triggered downside follow-through so far to $1426.95.
Where is this move heading? All roads point to downside continuation into the $1400 area, which not only will satisfy a swing target off of the recent recovery highs around $1485/87, but it also represents the 50% give-back support plateau of the entire upleg from $1321.50 to $1487.62.
If and when gold hits that downside target zone, we will reevaluate the technical set-up to determine if gold remains in a developing intermediate-term bottoming pattern, or is in the grasp of a new downleg that should press to new lows beneath $1321.50?

