Gold Miners ETF Poised for Another Downside Loop
By Mike Paulenoff, www.MPTrader.com
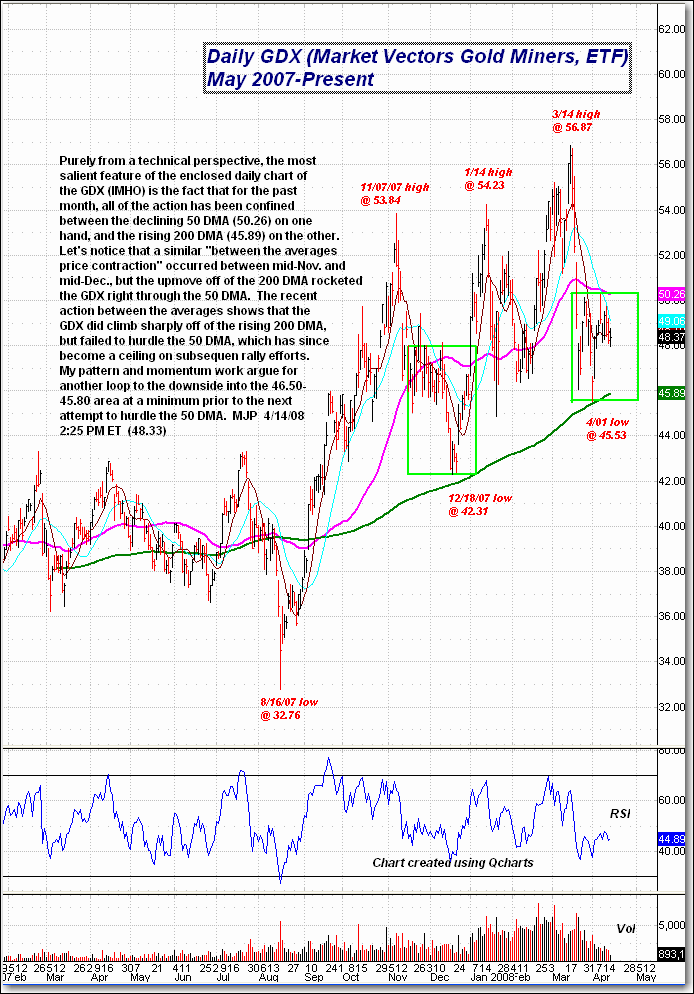
Purely from a technical perspective the most salient of the daily chart of the Market Vectors Gold Miners ETF (AMEX: GDX) is the fact that for the past month all of the action has been confined between the declining 50 DMA (50.26) on one hand the rising 200 DMA (45.89) on the other. Let's notice that a similar "between the averages price contraction" occurred between mid-Nov and mid-Dec, but the upmove off the 200 DMA rocketed the GDX right through the 50 DMA. The recent action between the averages shows that the GDX did climb sharply off of the rising 200 DMA, but failed to hurdle the 50 DMA, which has since become a ceiling on subsequent rally efforts. My pattern and momentum work argue for another loop to the downside into the 46.50-45.80 area at a minimum prior to the next attempt to hurdle the 50 DMA.

