Gold in Bullish Coil
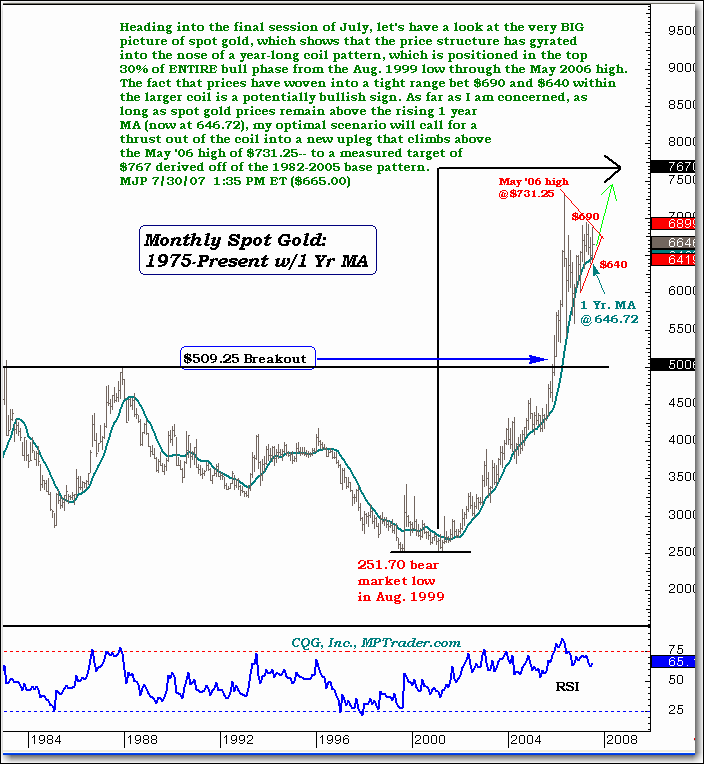
Heading into the final session of July, let's have a look at the very big picture of spot gold, which shows that the price structure has gyrated into the nose of a year-long coil pattern, which is positioned in the top 30% of the entire bull phase from the August 1999 low through the May 2006 high. The fact that prices have woven into a tight range between $690 and $640 within the larger coil is a potentially bullish sign for traders of gold, including the streetTRACKS Gold Shares (NYSE: GLD). As far as I am concerned, as long as spot gold prices remain above the rising 1-year MA (now at 626.72), my optimal scenario will call for a thrust out of the coil into a new upleg that climbs above the May 2006 high of $731.25 -- to a measured target of $767 derived off the 1982-2005 base pattern.

