Gold's Sideways Pattern Should Resolve Itself to the Upside
Meanwhile, the dollar is under pressure vs. the Euro, which is sitting near its historical high, and has declined 6% vs. the Yen since late June... which probably deserves some credit for putting a floor under gold prices recently.
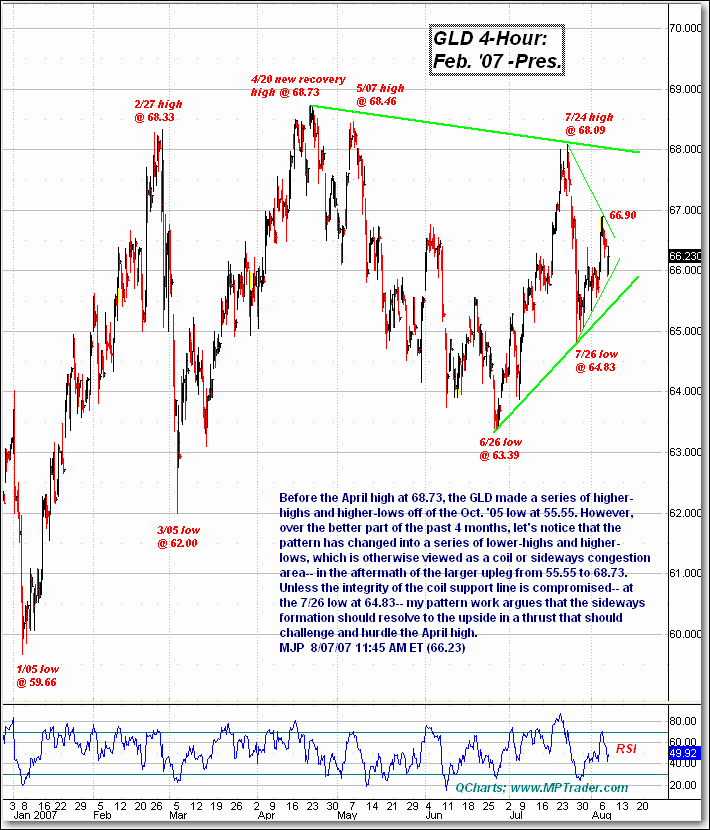
Let's have a look at the near term pattern that has developed in the GLD. Before the April high at 68.73, the GLD made a series of higher-highs and higher-lows off of the October 2005 low at 55.55. However, over the better part of the past 4 months, let's notice that the pattern has changed into a series of lower-highs and higher-lows, which is otherwise viewed as a coil or sideways congestion area -- in the aftermath of the larger upleg from 55.5 to 68.73.
Unless the integrity of the coil support line is compromised -- at the 7/26 low at 64.83 -- my pattern work argues that the sideways formation should resolve itself to the upside in a thrust that should challenge and hurdle the April high.

