Gold's Upside Breakout - Market Analysis for Feb 11th, 2009
By Mike Paulenoff, www.MPTrader.com
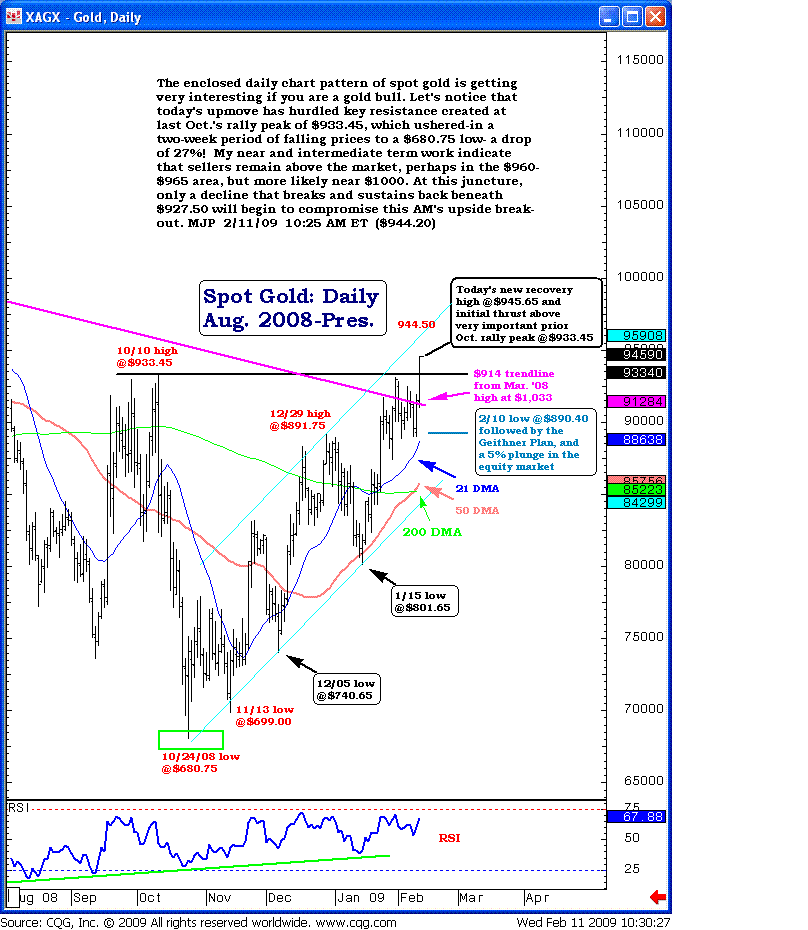
Spot Gold prices and the SPDR Gold Trust ETF (NYSE: GLD) are on the move again-- to the upside-- doing damage to key resistance levels. The enclosed daily chart pattern of spot gold is getting very interesting if you are a gold bull. Let's notice that today's upmove has hurdled key resistance created at last October's rally peak of $933.45, which ushered in a two-week period of falling prices to a $680.75 low -- a drop of 27%. My near and intermediate-term work indicate that sellers remain above the market, perhaps in the $960-$965 area, but more likely near $1000. At this juncture, only a decline that breaks and sustains back beneath $927.50 will begin to compromise this morning's upside breakout.

